2006BASED PUPIL PROJECTIONS METHODOLOGY 1 THE MODELLING PROCESS USES
2006BASED PUPIL PROJECTIONS METHODOLOGY 1 THE MODELLING PROCESS USES
Primary school pupil number projections
2006-based pupil projections
Methodology
The modelling process uses information from:
a) Pupil Census September 2006 and previous.
b) General
Register Office for Scotland - mid-year population estimates up to
2006.
c) General Register Office for Scotland - 2006 based
population projections
Firstly, the percentage of pupils of each age, in each sector, compared to the total number of children in the population was calculated.
Then, for a given cohort moving through the school, the participation rate for a given year was projected using the knowledge of the previous year's participation rate for that cohort, together with the average change in participation rates at that age. For example, if 98.2% of 6 year-olds were in mainstream primaries in 2005, and on average over the past four years the participation rate of 6 year-olds had increased 0.3 percentage points by the time they are 7, then the projected participation rate for 7 year-olds in 2006 would be 98.5%.
A similar methodology was used for 16 - 18 year olds, but some changes were made to avoid distortion due to leavers. The average change in participation rates were based on fewer years, so that more recent years were given greater weight. In addition, where the participation rate for 17 and 18 year-olds resulted in a lower participation rate than the average over 2003 to 2005, the average was used instead.
The participation rates for 19 year olds was calculated using the 4 year average rates for 2002-2005.
Participation rates for cohorts not yet in the system were calculated using four year average rates for 3, 4 and 5 year-olds, which are then projected forward using the same methodology as above.
No adjustments have been made for the effect of mainstreaming or of changes in the proportion in the independent sector.
The local authority projections have then been scaled so as to sum to the Scotland-level projection. Rounded figures are published.
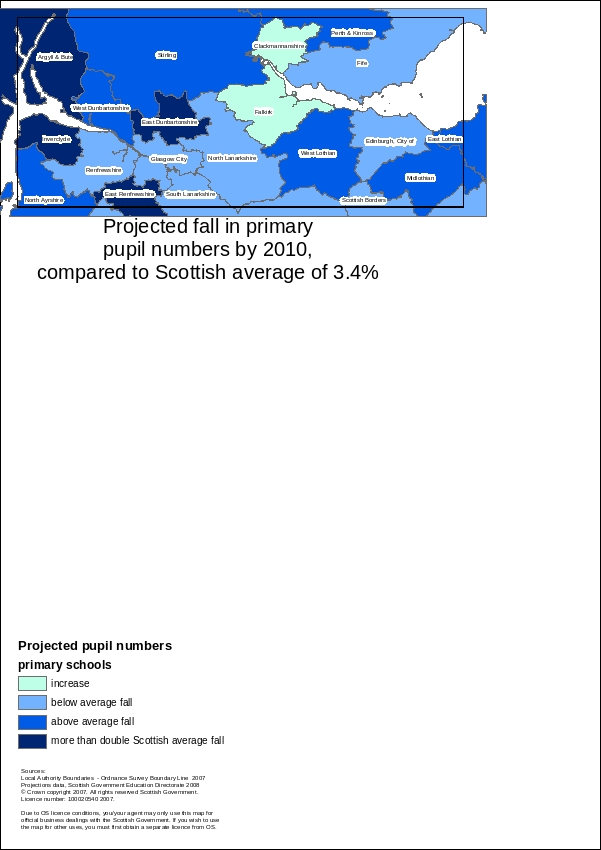
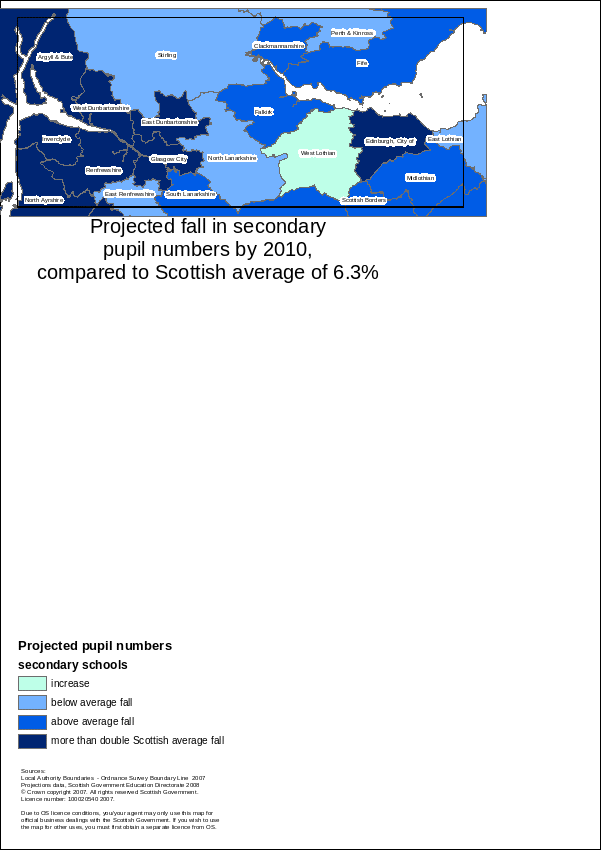
Maps on the following pages show the percentage decrease of primary and secondary pupils by local authority between 2006 and 2010.
For further details please contact Mal Cooke
Tel: 0131 244 1689
e-mail: [email protected]
Primary school pupil number projections(1)
|
|
2006 |
2007 |
2008 |
2009 |
2010 |
|
Aberdeen City |
12,300 |
12,300 |
12,200 |
12,100 |
12,100 |
|
Aberdeenshire |
19,500 |
19,300 |
19,100 |
19,100 |
19,100 |
|
Angus |
9,000 |
8,900 |
8,900 |
8,900 |
8,900 |
|
Argyll & Bute |
6,500 |
6,100 |
5,900 |
5,800 |
5,500 |
|
Clackmannanshire |
4,000 |
3,900 |
3,900 |
3,900 |
4,000 |
|
|
|
|
|
|
|
|
Dumfries & Galloway |
11,000 |
10,600 |
10,500 |
10,200 |
10,200 |
|
Dundee City |
9,900 |
9,900 |
9,800 |
9,800 |
9,900 |
|
East Ayrshire |
9,400 |
9,300 |
9,300 |
9,200 |
9,200 |
|
East Dunbartonshire |
8,900 |
8,600 |
8,300 |
7,900 |
7,700 |
|
East Lothian |
7,600 |
7,300 |
7,200 |
7,100 |
7,200 |
|
|
|
|
|
|
|
|
East Renfrewshire |
8,400 |
8,300 |
8,200 |
8,000 |
7,800 |
|
Edinburgh, City of |
25,100 |
24,600 |
24,400 |
24,200 |
24,400 |
|
Eilean Siar |
2,000 |
2,000 |
1,900 |
1,900 |
1,900 |
|
Falkirk |
11,600 |
11,600 |
11,600 |
11,700 |
11,800 |
|
Fife |
27,200 |
26,800 |
26,700 |
26,500 |
26,500 |
|
|
|
|
|
|
|
|
Glasgow City |
38,600 |
38,300 |
38,000 |
37,900 |
38,200 |
|
Highland |
17,300 |
17,300 |
17,200 |
17,200 |
17,100 |
|
Inverclyde |
6,000 |
5,900 |
5,700 |
5,600 |
5,600 |
|
Midlothian |
6,500 |
6,400 |
6,300 |
6,200 |
6,100 |
|
Moray |
7,200 |
7,000 |
6,800 |
6,600 |
6,500 |
|
|
|
|
|
|
|
|
North Ayrshire |
10,800 |
10,600 |
10,500 |
10,300 |
10,300 |
|
North Lanarkshire |
27,300 |
27,100 |
26,900 |
26,800 |
26,700 |
|
Orkney Islands |
1,600 |
1,500 |
1,500 |
1,400 |
1,400 |
|
Perth & Kinross |
10,200 |
10,100 |
10,000 |
9,900 |
9,800 |
|
Renfrewshire |
13,400 |
13,200 |
13,100 |
13,000 |
13,000 |
|
|
|
|
|
|
|
|
Scottish Borders |
8,500 |
8,400 |
8,400 |
8,400 |
8,400 |
|
Shetland Islands |
1,900 |
1,800 |
1,800 |
1,800 |
1,800 |
|
South Ayrshire |
8,100 |
8,000 |
7,800 |
7,700 |
7,600 |
|
South Lanarkshire |
24,200 |
23,900 |
23,600 |
23,500 |
23,500 |
|
Stirling |
6,900 |
6,800 |
6,700 |
6,600 |
6,600 |
|
|
|
|
|
|
|
|
West Dunbartonshire |
7,100 |
6,900 |
6,700 |
6,600 |
6,600 |
|
West Lothian |
14,700 |
14,400 |
14,300 |
14,200 |
14,200 |
|
|
|
|
|
|
|
|
Total |
382,300 |
377,200 |
373,200 |
370,200 |
369,200 |
(1) Projections rounded to the nearest 100, so may not add to total.

Secondary school pupil number projections(1)
|
|
2006 |
2007 |
2008 |
2009 |
2010 |
|
Aberdeen City |
10,400 |
10,100 |
9,900 |
9,500 |
9,200 |
|
Aberdeenshire |
15,700 |
15,700 |
15,500 |
15,200 |
15,000 |
|
Angus |
7,100 |
7,100 |
7,000 |
6,900 |
6,900 |
|
Argyll & Bute |
5,700 |
5,600 |
5,500 |
5,300 |
5,200 |
|
Clackmannanshire |
3,000 |
3,000 |
2,900 |
2,900 |
2,800 |
|
|
|
|
|
|
|
|
Dumfries & Galloway |
9,600 |
9,500 |
9,300 |
9,100 |
9,000 |
|
Dundee City |
8,100 |
8,000 |
7,900 |
7,800 |
7,600 |
|
East Ayrshire |
7,900 |
7,700 |
7,500 |
7,300 |
7,100 |
|
East Dunbartonshire |
8,000 |
7,800 |
7,500 |
7,200 |
7,000 |
|
East Lothian |
5,900 |
5,900 |
5,900 |
5,800 |
5,700 |
|
|
|
|
|
|
|
|
East Renfrewshire |
7,700 |
7,700 |
7,700 |
7,700 |
7,700 |
|
Edinburgh, City of |
19,700 |
19,300 |
18,800 |
18,300 |
17,800 |
|
Eilean Siar |
1,900 |
1,800 |
1,800 |
1,800 |
1,800 |
|
Falkirk |
9,200 |
9,000 |
8,800 |
8,700 |
8,600 |
|
Fife |
22,100 |
21,900 |
21,500 |
21,100 |
20,800 |
|
|
|
|
|
|
|
|
Glasgow City |
28,200 |
27,500 |
26,900 |
26,300 |
25,700 |
|
Highland |
14,900 |
15,000 |
15,000 |
14,800 |
14,700 |
|
Inverclyde |
5,300 |
5,200 |
5,000 |
4,900 |
4,700 |
|
Midlothian |
5,500 |
5,400 |
5,200 |
5,100 |
5,100 |
|
Moray |
5,900 |
5,900 |
5,800 |
5,700 |
5,600 |
|
|
|
|
|
|
|
|
North Ayrshire |
9,000 |
8,800 |
8,600 |
8,500 |
8,200 |
|
North Lanarkshire |
21,800 |
21,500 |
21,300 |
21,200 |
21,100 |
|
Orkney Islands |
1,500 |
1,400 |
1,400 |
1,400 |
1,400 |
|
Perth & Kinross |
7,900 |
7,900 |
8,000 |
7,900 |
7,800 |
|
Renfrewshire |
11,400 |
11,100 |
10,900 |
10,700 |
10,500 |
|
|
|
|
|
|
|
|
Scottish Borders |
7,000 |
6,900 |
6,800 |
6,700 |
6,600 |
|
Shetland Islands |
1,700 |
1,600 |
1,600 |
1,500 |
1,500 |
|
South Ayrshire |
7,200 |
7,000 |
6,800 |
6,700 |
6,600 |
|
South Lanarkshire |
20,000 |
19,700 |
19,500 |
19,100 |
18,700 |
|
Stirling |
6,000 |
6,000 |
6,000 |
5,900 |
5,900 |
|
|
|
|
|
|
|
|
West Dunbartonshire |
6,200 |
6,000 |
5,900 |
5,700 |
5,500 |
|
West Lothian |
10,900 |
11,000 |
10,900 |
11,000 |
10,900 |
|
|
|
|
|
|
|
|
Total |
312,400 |
308,300 |
303,000 |
297,900 |
292,600 |
(1) Projections rounded to the nearest 100, so may not add to total.

Tags: process, projections, pupil, 2006based, methodology, modelling
- STJCE DE 16 DE NOVIEMBRE DE 2006 – ASUNTO
- !DOCTYPE HTML HTML CLASSNOJS LANGENGB HEAD META CHARSETUTF8 META
- COLEGIO OFICIAL DE TRABAJO SOCIAL DE BADAJOZ HOJA DE
- SCI YAYINLARININ TÜRKÇE ÖZETI 1 OK AÇILI BIR SIKIŞMA
- Form Request to Rely on an External irb (initial
- Simple Spring Rolls Complexity Medium Ingredients 1x Small Carrot
- CHILDHOODONSET MULTIPLE SELF INJURIOUS BEHAVIOURS IN GILLES DE LA
- 15A NCAC 10B 0405 FUR DEALERS (A) IT IS
- REFERENT HERRLE JÖRG BEDINGUNGSANALYSE BEI DER PLANUNG VON LERNPROZESSEN
- EL CORREO EL PAPA CIERRA EL ‘CASO GAZTELUETA’
- ALL CORRESPONDENCE TO MEAT & LIVESTOCK AUSTRALIA LIMITED ABN
- REPUTATION ACCOMPANYING PICTURE REPRESENTS THE FIRST (LARGER) NUMBER 1
- BOARD OF COUNTY COMMISSIONERS’ MEETINGS & DEADLINE DATES FOR
- CHAPTER 6 BOUNDARYVALUE PROBLEMS EXAMPLE 631 SOLVE
- VERSION 5 PRIVATE PATIENT’S WEBSITE CLINICAL SERVICE CONTENT 2017
- UNIVERSIDAD TÉCNICA DE ORURO FACULTAD NACIONAL DE INGENIERÍA CARRERA
- DKS CBS FO 16 MUMBAI PORT TRUST DOCKS RECEIPT
- RBVM BLOWER RANGE POSITIVE DISPLACEMENT AIR BLOWERS BULK BLOWING
- NA OSNOVU ČL 14 I 15 PRAVILNIKA O UTVRĐIVANJU
- 2 INFORMATIKOS IR RYŠIŲ DEPARTAMENTO PRIE LIETUVOS RESPUBLIKOS VIDAUS
- INFORME DE AUDITORÏA INTERNA PROMOCION Y PREVENCION FECHA DE
- SỞ LĐTB&XH TỈNH BÌNH DƯƠNG TRƯỜNG TC KINH TẾ
- E L PASADO MARTES 23 DE NOVIEMBRE LA ANTIGUA
- FICHE CNIL DROITS DES PERSONNES DROIT D’ACCES 1
- 4 HARDVER 1 A SZÁMÍTÓGÉP MODULÁRIS FELÉPÍTÉSE A MODULARITÁS
- Miejscowość Data nr Zamówienie Regulaminu na rjp
- UCHWAŁA NR XIX1762004 RADY MIEJSKIEJ W WOŁCZYNIE Z DNIA
- CONTRATO DE PRESTACIÓN DEL SERVICIO DE TRASVASE DE GNL
- STJCE DE 10 DE DICIEMBRE DE 1985 – ASUNTO
- JOB DESCRIPTION CHAIR OF THE BOARD | TESYOUTH
ALASKA VA HOME OXYGEN PRESCRIPTION ORDERING FORM & CLINICAL
 5 EKSTRAKCJA ZADANIE 1 W FAZIE WODNEJ O OBJĘTOŚCI
 SEMANA 26 EXPERIENCIA DE APRENDIZAJE REFLEXIONAMOS SOBRE NUESTROS APRENDIZAJES
REV 20060809 CHECKLISTA REGISTRERING NYBESÖK I BORIS DENNA CHECKLISTA
DRAFT AS OF THE FOLLOWING TERMS AND CONDITIONS
 HTTPWWWCRISTINASANTIAGOESSINGLEPOST20170215HOGARSINTC393XICOSIAGUAEMBOTELLADAC2BFSALUDABLEOCC3B3CTELDETC3B3XICOS HOGAR SIN TÓXICOS (I) AGUA EMBOTELLADA ¿SALUDABLE O
BASES PARTICULARS PER LA CONVOCATÒRIA DE SUBVENCIONS PER LA
` OCTOBER 25 2021 PAGE 3 DEPARTMENT OF ADMINISTRATIVE
 TOPIC EXPLORATION PACK INTRODUCTION TO THE NATURE OF
TOMORROW IS VALENTINE’S DAY AND LOCAL RESTAURANTS WILL BE
NEMZETI BIONIKAI PROGRAMBÓL FINANSZÍROZOTT KUTATÁSI PROJEKT A NEMZETI BIONIKA
 5.%20R1732018
SPISAK ODOBRENIH RADNIH UDŽBENIKA UDŽBENIKA PRIRUČNIKA RADNIH LISTOVA I
 REPUBLIKA HRVATSKA KRAPINSKO – ZAGORSKA ŽUPANIJA OPĆINA HUM NA
СКУПШТИНА ГРАДСКЕ ОПШТИНЕ ВОЖДОВАЦ НА СЕДНИЦИ ОДРЖАНОЈ 10 НОВЕМБРА
 AMASYA ÜNİVERSİTESİ BİLİMSEL ARAŞTIRMA PROJELERİ KOORDİNASYON BİRİMİ PROJE BAŞVURU
HR NO 494 HR NO 494 R E S
MEMORANDUM PONUDITELJA HRVATSKI ZAVOD ZA ZDRAVSTVENO OSIGURANJE DIREKCIJA
UIO KUN 1030 VÅR 2006 QUATTROCENTO FLORENTINSK UNGRENESSANSE MALERIET
PSYCHOLOGY 54 CLOSE RELATIONSHIPS COURSE INSTRUCTOR CATHERINE A