WORKSHOP 1 HANDOUT 2 STATISTICAL INVESTIGATION WORKSHEET PROBLEM
10 III HEMISPHERIC WORKSHOP ON OCCUPATIONAL HEALTHAFRICA REGIONAL TRAINING WORKSHOP (ANGLOPHONE) SUPPORTING COUNTRIES
FROM IPPC SERVICES SUBJECT IPP TRAINING WORKSHOP –
SCHEDA ISCRIZIONE WORKSHOP RACCOLTA FONDI E BILANCIO SOCIALE
SWG RURAL WORKSHOP AND READING PROGRAM GUIDELINES FOR
WORKSHOP MOLECULAR PHOTOREACTIVITY ON METALOXIDE SURFACES FROM FIRSTPRINCIPLES
PROBLEM: Do the heights of Karekare College boys tend to be greater than the heights of Karekare College girls
Workshop 1 - Handout 2
Statistical Investigation Worksheet
PROBLEM
PLAN/DATA
ANALYSIS (Attach your plot here)
Middle 50% (Description of the sample distributions)
Shift: From the samples I notice…
Overlap: From the samples I notice …
Anything unusual: (Clusters, outliers, groups)
From the samples I notice…
I worry or think that …
Shape: (Describe the shape of each sample distribution, compare the shapes of the two sample distributions):
From the samples I notice…
Back in the two populations I wonder if …
Spread: (Describe the spread of each sample distribution, compare the spreads of the two sample distributions)
From the samples I notice…
Back in the two populations I wonder if …
CONCLUSION (This is dealt with in Workshop 2)
Answer the problem:
I would claim that . . .
Explain why you have made this conclusion:
Statistical Investigation Exemplar
PROBLEM
Do the heights of Karekare College boys tend to be greater than the heights of Karekare College girls?
PLAN/DATA
Take a sample of 30 boys and 30 girls from the Karekare College population.
ANALYSIS
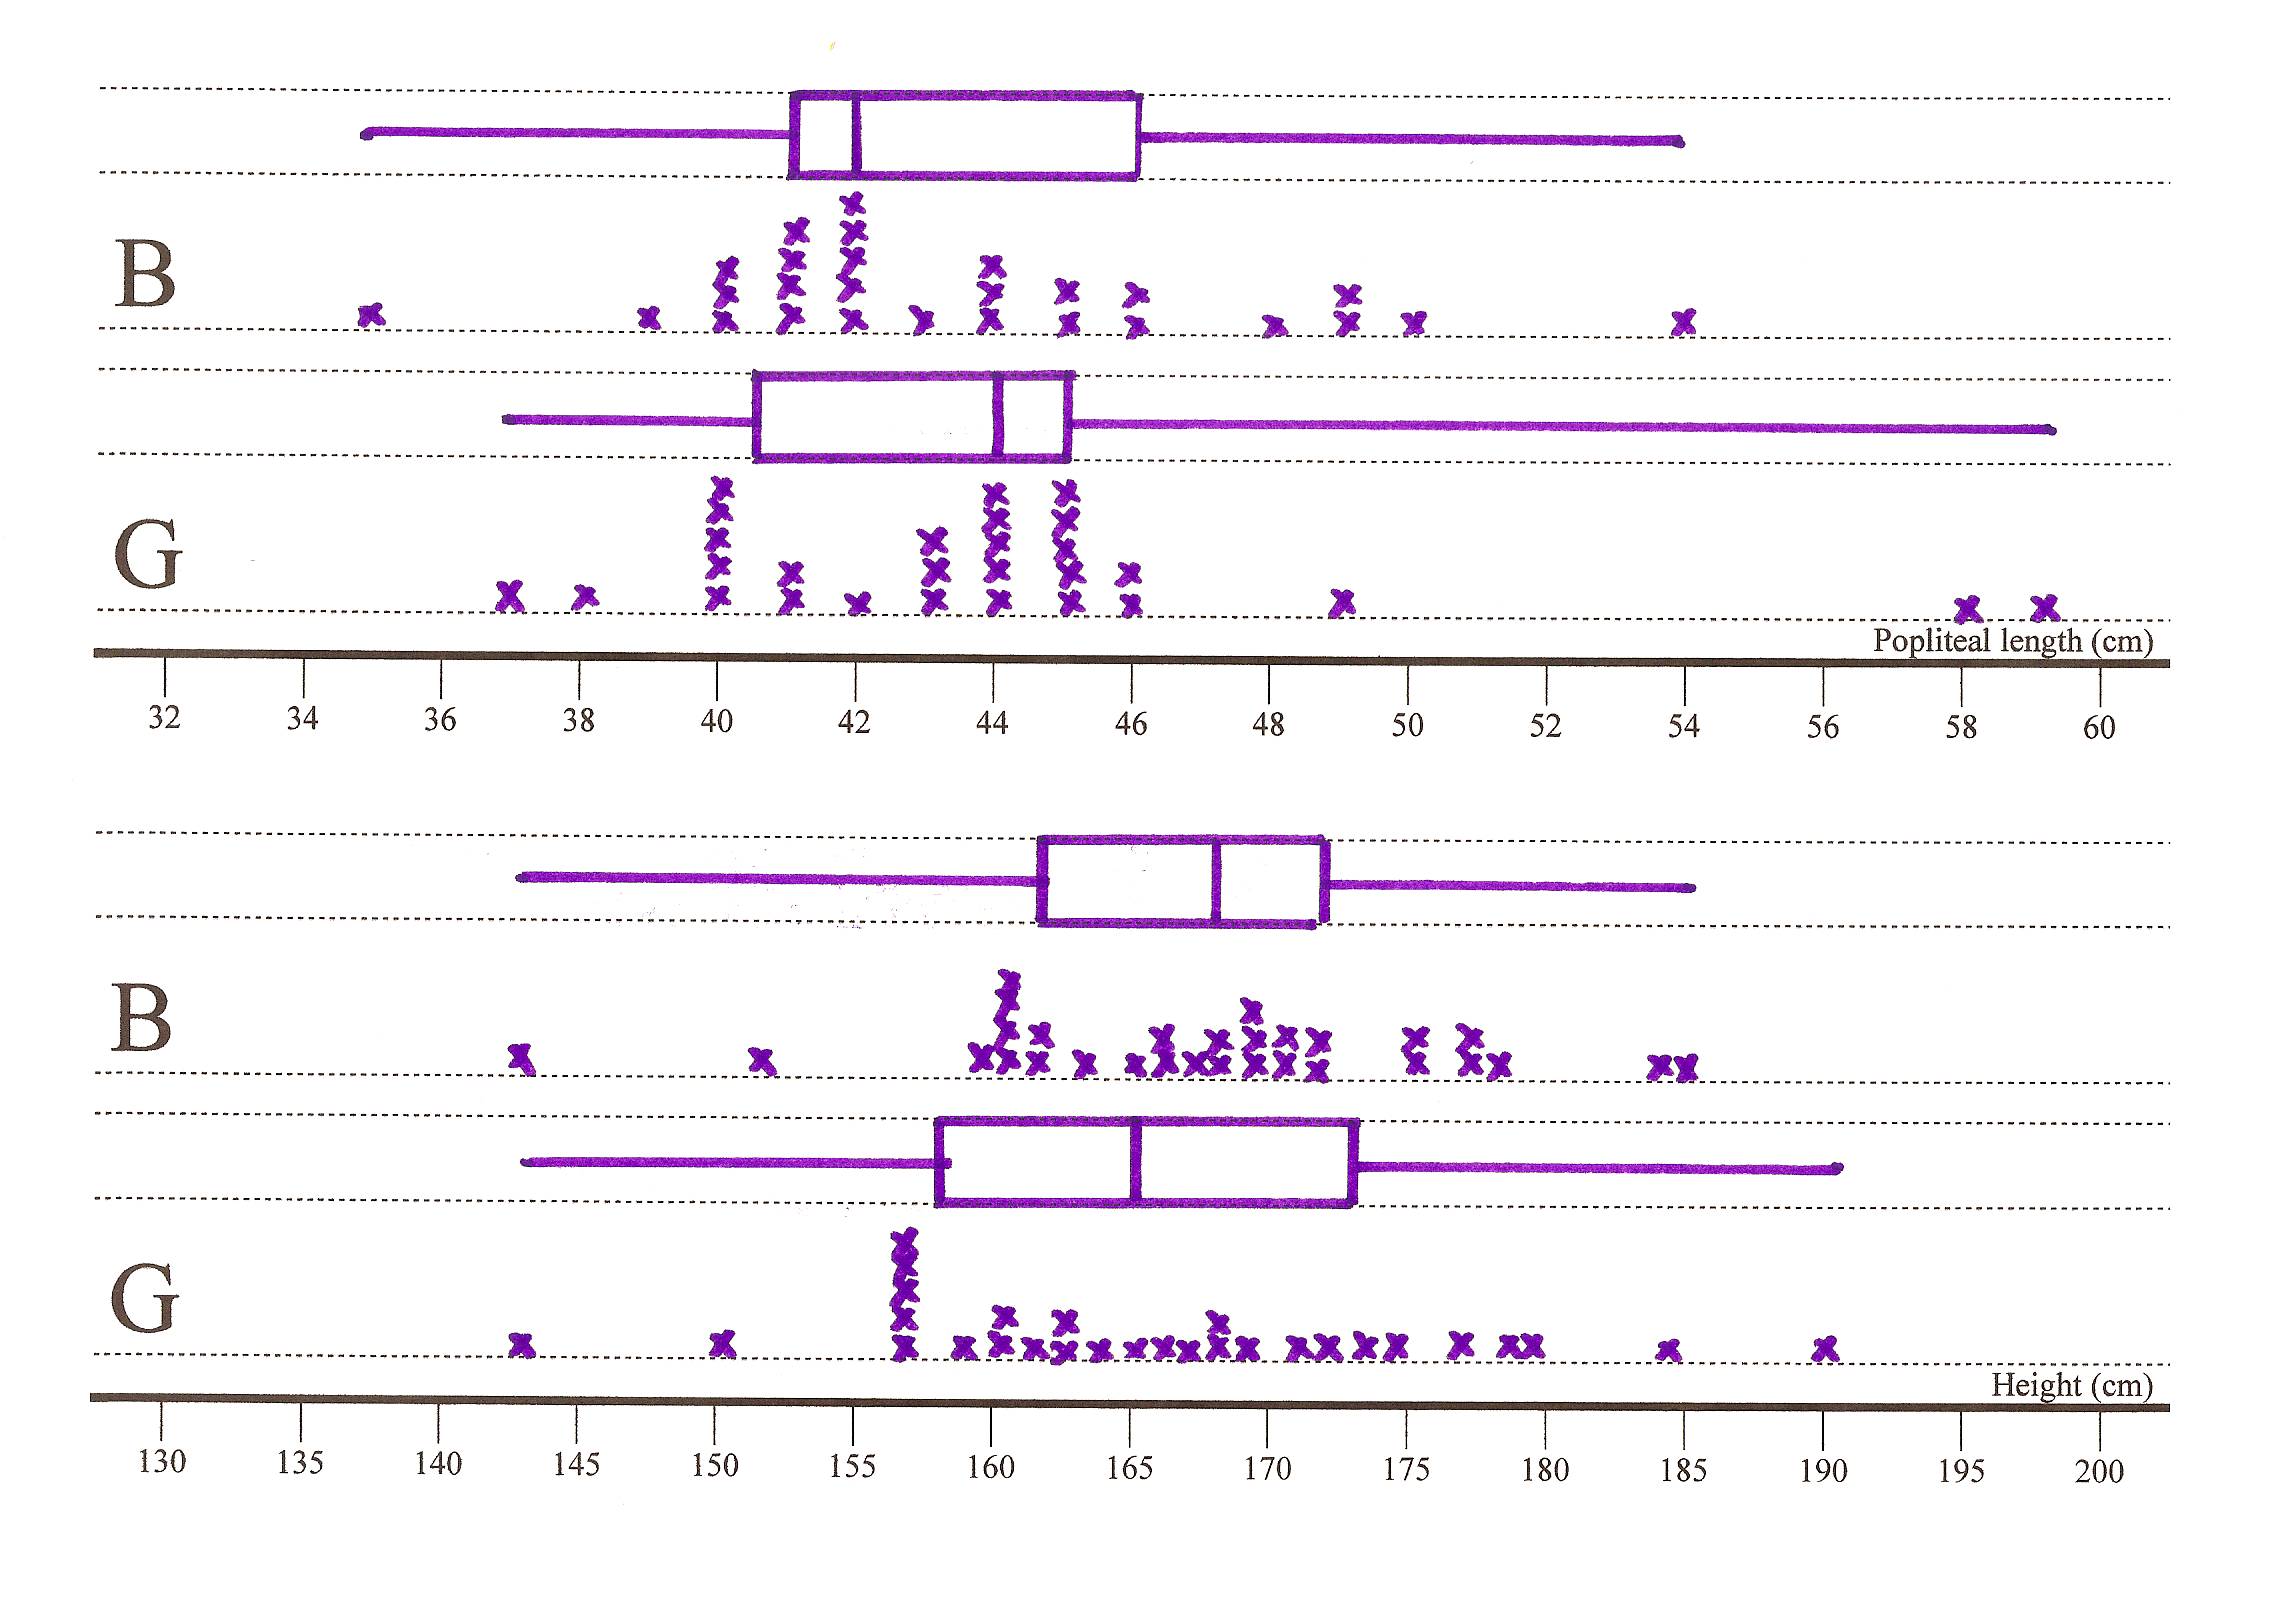
Middle 50%:
Shift: From the samples I notice…
that
heights of these boys are shifted slightly further up the scale
than heights of these girls.
Overlap: From the samples I notice …
that
the heights of these girls completely overlaps the heights of
these boys.
Anything unusual:
From the samples I notice… nothing unusual
I worry or think that …
Shape:
Describe the shape of each sample distribution, compare the shapes of the two sample distributions
Description of the sample distribution shape is what we see and also guided by what we suspect is the shape of the population/underlying distribution. We tend to ignore any features which may just be due to sampling variability. For shape we describe symmetry (e.g. symmetrical or skewed) and modality (e.g. unimodal, bimodal etc).
Sometimes a re-scaling of axis is required to see the shape
From the samples I notice…
that the heights of both these groups are a mound shape. The mound for these boys and girls is around 165cm. (Imagine making 5cm class intervals.)
that the heights for girls are symmetrical and the heights for boys are roughly symmetrical.
Back in the two populations I wonder if …
the
shapes will be like these. I expect so.
(From
my contextual knowledge what I would expect population distributions
to look like)
Spread:
Describe the spread of each sample distribution, compare the spreads of the two sample distributions
Use the spread of the middle 50% (IQR) – don’t use range
From the samples I notice…
that the middle 50% of these girls heights is slightly more spread out than the middle 50% of these boys heights.
these girls’ heights IQR = 174 - 158 = 16 cm
these boys’ heights IQR = 172 – 162 = 10 cm
Back in the two populations I wonder if …
the
spreads will be like these. I would expect the population spreads to
be
similar. (From
my contextual knowledge and what I would expect population
distributions to look like)
CONCLUSION (This is dealt with in Workshop 2)
Answer the problem:
“Do the heights of Karekare College boys tend to be greater than the heights of Karekare College girls?”
I would claim that . . .
Explain why you have made this conclusion.
Workshop 1 Information
Students should be familiar with:
Posing investigative questions for summary and comparison situations
Writing full descriptions for summary and comparison situations from dot plots
Population and its meaning within the statistics curriculum
Collecting data, especially using the CensusAtSchool survey 2009 questionnaire and making measures for the CensusAtSchool survey
Cleaning data, particularly familiar with body measurement data, possible sources of error, sensible ranges of values
|
Concept |
Level 4 |
Level 5 |
Level 6 |
|
Posing investigative questions |
About the specific group or sample of data given |
About the population |
About the population |
|
Sampling |
Growing samples leading to population idea |
Sampling variability |
Sample size |
|
Type of data analysis |
Dot plots
|
Dot plots Box plots Summary statistics |
Dot plots Box plots Summary statistics |
|
Description I notice |
Of the data given (group or sample) |
Sample |
Sample |
|
Inferential thoughts I wonder |
|
About the populations |
About the populations |
|
Contextual thoughts I expect, I worry |
|
Eg measurement issues, data quality, shape of population distributions |
Is there an alternative explanation? |
Curriculum Achievement Objectives
Statistical investigations:
|
S4-1 Plan and conduct investigations using the statistical enquiry cycle: A determining appropriate variables and data collection methods B gathering, sorting, and displaying multivariate category, measurement, and time-series data to detect patterns, variations, relationships, and trends C comparing distributions visually D communicating findings, using appropriate displays. |
|
S5-1 Plan and conduct surveys and experiments using the statistical enquiry cycle: A determining appropriate variables and measures B considering sources of variation C gathering and cleaning data D using multiple displays, and re-categorising data to find patterns, variations, relationships, and trends in multivariate data sets E comparing sample distributions visually, using measures of centre, spread, and proportion F presenting a report of findings. |
|
S6-1 Plan and conduct investigations using the statistical enquiry cycle: A justifying the variables and measures used B managing sources of variation, including through the use of random sampling C identifying and communicating features in context (trends, relationships between variables, and differences within and between distributions), using multiple displays D making informal inferences about populations from sample data E justifying findings, using displays and measures. |
Key Ideas from Workshop One:
1. Link between sample and population.
2. Students need to experience the need to sample.
3. Describe sample distributions and think about the population distributions.
4. Predict population distributions.
5. Care with language, these boys, these girls.
All handouts and classroom materials are located on CensusAtSchool. http://www.censusatschool.org.nz/
Click on new curriculum and then informal inference.
Statistics
Teacher Day Nov 09
WTO REGIONAL WORKSHOP FOR THE GULF ARAB COUNTRIES
(ASOSAISPONSORED WORKSHOP IN 2017) ANNEX 5 ANNEX 5
0 1ST INTERNATIONAL WORKSHOP | ADVANCES IN CLEANER PRODUCTION
Tags: handout 2, statistical, handout, investigation, worksheet, problem, workshop
- AYUNTAMIENTO DE OCENTEJO PLAZA MAYOR 1 19432OCENTEJO (GUADALAJARA) ANUNCIO
- FUNDUSZ MIKROPROJEKTÓW EUROREGIONU BESKYDYBESKIDY VERSJA 2 PŘÍLOHA Č M18
- ORDER OF THE ARROW NEW HORIZONS CHAPTER OF THE
- 26 DE MAYO DE 2008 DIARIO OFICIAL ACUERDO QUE
- GLOSSARY OF TERMS AQP ADVANCING QUEENSLAND’S PRIORITIES ARRS ANNUAL
- Miércoles 3 de Junio de 2015 Diario Oficial (primera
- COMPANY PROFILES FOR THE SINOAUSTRIAN BUSINESS FORUM ON 4TH
- INSTRUCTIONAL PACKAGE CUL 104 INTRODUCTION TO CULINARY ARTS EFFECTIVE
- ICAMA FORM 75B IMPORTANT INFORMATION ICAMA PROFESSIONALS CHILD’S
- a Compendium of Three Discussion Papers Strategies for
- 8 PROJEKTAS NR 12TS41 JONAVOS RAJONO SAVIVALDYBĖS TARYBA SPRENDIMAS
- BRIEFING FOR AN EXTERNAL EXAMINER WHERE THE EXTERNAL EXAMINER
- ZAMÓWIENIE NR PRACOWNIA REPROGRAFICZNA BUW UL DOBRA 5666
- 38 ORIENTACIONES PARA ELABORAR PROYECTOS DE ESTATUTOS DE
- TRYB PRZEPROWADZANIA CZYNNOŚCI W POSTĘPOWANIU O NADANIE TYTUŁU PROFESORA
- APPROVED BY IRB ON (FOR OIC USE ONLY) EXPIRES
- RADNA UPUTA STRANICA 4 OD 4 ZAŠTITA VOĆA I
- STAJMADRID SINDICATO DE TRABAJADORES DE LA ADMINISTRACION DE JUSTICIA
- BURSA DE VALORI BUCURESTI SA REINFIINTAT LA DATA DE
- STG2APPENDIX I SPACE TASK GROUP (STG) OF THE IPY
- PERMISSION TO USE PHOTOGRAPH(S) THE GEOSCIENTISTS CANADA OFTEN
- Methodology Assessment Rubric a b c d e f
- A TLANTA SOUTHERN CRESCENT ALUMNAE PANHELLENIC ASSOCIATION 2013 SORORITY
- ANSØGNINGSSKEMA TIL BOLIGER FOR ÆLDRE OG HANDICAPPEDE SKEMAET INDSENDES
- TILTAK I KOMMUNENS KULTURSATSING RULLERT I MALVIK KOMMUNESTYRE 160902
- LA GUERRA GLOBALE LA GUERRA GLOBALE LA COSIDDETTA
- ORGANIZACIONA KULTURA KOJA PREDSTAVLJA SKUP BAZIČNIH VREDNOSTI UVERENJA I
- INTRODUCCIÓN OPCIONAL QUÉ VAMOS A HACER PROBAR UNA FORMA
- PROGRAM POLITYKI ZDROWOTNEJ FINANSOWANY ZE ŚRODKÓW BUDŻETOWYCH POWIATU POZNAŃSKIEGO
- Werken met een Doelboom een Doelboom Helpt u om
JAN DURHAM HIRSCH BPHARM PHD UNIVERSITY OF CALIFORNIA IRVINE
 I LLIGA DE FUTBOL 7 SPECIAL OLYMPICS ACELL
LETTER HEAD TRANSFEREE ATTACHMENT 8 A LETTER OF UNDERTAKING
 ORDEN SAN2962020 DE 11 DE MARZO POR LA QUE
 CONCIERTOS DE CICLO TEMPORADA 20102011 CONCIERTOS DE CICLO TEMPORADA
 FEDERAL COMMUNICATIONS COMMISSION FCC 01264 BEFORE THE FEDERAL COMMUNICATIONS
 B ASHA HIGH SCHOOL BANDS CONCERT BAND SYLLABUS 1
 INFORME DE EJECUCIÓN DEL PROYECTO INFORME B TITULO DEL
 POSTUPCI PRI POJAVI UŠI VJEROJATNO I VI PRIPADATE MNOGIMA
JELENTKEZÉSI FELHÍVÁS TISZTELT KOLLÉGANŐKOLLÉGA! A MAGYAR JOGÁSZ EGYLET SOK
RHFONDJLSJP(R)S OPĆINA DOMAŠINEC RAZINA 2223 RAZDJEL RKP 33101
 2 FLORES – SAJAM CVIJEĆA BJELOVAR SAJAM CVIJEĆA LJEKOVITOG
M PETER DEMPSEY SAG AEA OMPA HEIGHT 6’1’ WEIGHT195
REFERENCE WLI100 8 FEBRUARY 2007 MARRAKESH AGREEMENT ESTABLISHING THE
CERTAIN PERSONS NOT TO HAVE FIREARMS DISORDERLY PERSONS OFFENSEDOMESTIC
MODELO ORIENTATIVO DE ACEPTACIÓN DE AYUDA O FORMULACIÓN DE
 COMPARATIVE RATE REVIEW TEMPLATE EXTERNAL COMPARISON I COMPANY NAME
КОНКУРС DNIPRO DANCE STARS ГДНЕПР 29102016 ГЛАВНЫЙ СУДЬЯ
 SOL·LICITUD DEL CARNET DEL CASAL DE JOVES DADES DELA
 TALLER CALCULO DE EMISIONES GASES EFECTO INVERNADERO NUESTRAS EMISIONES
