ABSTRACT INTRODUCTION MATERIALS AND METHODS I STILL HAVE TO
ABSTRACT FORM AUTHOR(S) TITLE INSTITUTION(S) ADRESS POSTAL(ABSTRACT TEMPLATE) FULL SCALE APPLICATION OF IN SITU AEROBIC
(DELETE THIS SECTION YOUR ABSTRACT SHOULD NOT EXCEED 2
0 TEMPLATE FOR THE PREPARATION OF ABSTRACTS AND FULL
1 ABSTRACT UMIYANTI DHITA 2009 THE IRONY OF MONEY
10 ABSTRACT INTRODUCTION PRIMARY OPEN ANGLE GLAUCOMA (POAG) IS
Introduction
-Abstract-
-Introduction-
-Materials and Methods-
-I still have to-
Replace all instances of Micrograms and microliters with the correct symbol.
change "Log of MW" in the standard curve to "Log of (# of Base Pairs)".
Add the KS lane bands into the table of the Excel graph (Uncut:4.6, 8.8, 10.4 Pst+, Xho, and Pst+/Xho: 8.8)
Perhaps increase accuracy of present Excel graph by splitting it into two best-fit lines.
Mark the lanes of Both Gel Images (Numerically, 1-20) and number the marker bands.
Transfer "efficiency of transformation" data into an excel graph.
-Results-
The following is the efficiency of the transformation according to the counts of the successful bacterial colonies.
The number of colonies that resulted on the different plates were:
Plate # of microL of plasmid # of colonies
-Amp+XGal+IPTG no plasmid Many many colonies
+Amp+XGal+IPTG no plasmid Zero colonies
+Amp+XGal+IPTG 2 microL of KS+ 152
+Amp+XGal+IPTG 10 microL of KS+ 334
+Amp+XGal+IPTG 2 microL of Chit 81
+Amp+XGal+IPTG 10 microL of Chit 378
The equation for the calculation of success of transformation per bacterium is as follows:
1mL of competent cells * 0.5*10^8 cells/mL * 0.1mL/2mL * dilution factor of 9 = 2.25*10^7 cells
so # of colonies/2.25*10^7 cells = X successful colonies/bacteria
The equation for the calculation of success of transformation per plasmid is as follows:
0.1 micrograms of plasmid dna * 1 g/10^7 microg * 1 plasmid/2961 Base Pairs * 1 Base Pair/600 Daltons * 1 Dalton/(1g/mole) * 6.02*10^23 molecules/mole * dilution factor of 9 = 3.05*10^10 plasmids
so # of colonies/(3.05*10^10) plasmids = # of successful colonies/plasmid
The equation for the calculation of success of transformation per microgram of plasmid DNA is as follows:
2 microL of plasmid * 50 micrograms of plasmid/1 microL * 1 something/.1 something * dilution factor of 9 = 9000 microg of plasmid
so # of colonies/9000 microg of plasmid = X successful colonies/microg of plasmid
[Insert Excel efficiency table here]
Quantification of Purified DNA
The purity of the DNA sample with respect to RNA contamination was determined using the ratio of absorbance at optical densities of DNA and RNA.
The ratio of OD260 to OD280 was 0.047/0.027, or 1.74, which is equivalent to 2.35 Micrograms/microLiter.
The DNA sample Concentration was calculated using the following equation:
(0.047 OD260 * 50 microg/mL per 1.0 OD260) * 500 times dilution factor = 1175 microg/mL = 1mL/1175microg = .000851 mL/microg * 1000 microL/mL = 0.851 microL/microg * 3 microg = 2.55 microL of DNA
Results of the SYBR Gel
[Insert labelled SYBR Gel Image here]
The SYBR Gel was not used due to the lack of clarity of the bands on the gel. Instead, the more distinct Ethidium bromide gel was used, since the bands on the gel were of the same type in the same locations.
Results of the Ethidium Bromide Gel
[Insert labelled Ethidium Bromide Image here]
The distance moved,
[Insert Table of Marker base pairs, Distance moved, and Log of Base Pairs, Standard curve, and]
Standard Curve from the Marker
[Insert Standard Curve Graph here]
Using the equation taken from the best fit line of the standard curve, the distances moved by the unknown length sequences were used in the equation "# of base pairs=(-.1277*distance travelled by the band)+4.6915" and then 10 was taken to the power of the resulting number in order to get the number of Base Pairs that the DNA in the band contained according to the standard curve.
[Insert Table for Unknown Sequence lengths here]
The second lane directly after the marker is the undigested Chit plasmid, and shows the presence of three bands. The first band moved 4.8 cm, indicating 12,00 Base Pairs, the second moved 6.8 cm, indicating 6,650 Base Pairs, and the third band moved 9.4 cm, indicating 3,100 Base Pairs.
In both lane 3 and 4, the Pst+ digest of Chit and the Xho digest of Chit, respectively, one band that moved 7.9 cm is visible, indicating the presence of 4,800 Base Pairs.
In lane 5, the double digested Chit plasmid, there was a slower band that moved 8.7 cm, indicating 3,800 Base Pairs, and a faster band that moved 13.8 cm, indicating 850 Base Pairs.
In lane 6, the undigested KS plasmid showed three bands which moved 4.6, 7.9, and 10.4 cm, indicating 24,000, 9000, and 4300 Base Pairs, respectively.
In lanes 7, 8, and 9, only one band, which moved 8.8 cm, is visible, indicating the presence of 6,900 Base Pairs.
In lane 19, three is a single band which moved 15 cm, indicating a sequence of 600 Base Pairs.
There are no bands in lane 20.
-Discussion-
The first band in lane 2 with 12,000 base pairs is probably the result of multiple DNA strands binding to eachother and forming a conglomerate DNA cluster. The second band in lane 2 with 6,654 apparent Base Pairs seems to be the nicked circular plasmid DNA, which would have moved slower than it should have for its true weight and the third band with an apparent 3,100 Base Pairs is probably the supercoiled plasmid DNA, which would have moved faster than average for its weight.
Lanes 3 and 4 both contain only one band at 4,800 Base Pairs, which is indicative of a linearized strand of DNA that was unable to recircularize after being fully cut by the restriction enzymes.
In Lane 5, the presence of a 3,800 Base Pair band and a 850 BP band as a result of two restriction enzyme digestions can be used to map the distance of the Pst+ digest site from the Xho digest site on the Chit plasmid, indicating a distance of 850 BP between the two restriction sites.
The difference of 150 base pairs between the sum of the lane five sequences and the 4,800 base pair sequences of lanes 3 and 4 may be attributable to the generalization the trendline makes on the standard curve. Seperate trend-lines for different areas of the curve, or ignoring certain data points at the smaller extreme entirely might allow for a more consistent estimation of the restriction site locations on the Chit plasmid.
[Insert a drawing of the the resulting restriction enzyme map of the 4,800 bp Chit plasmid, including Pst+ site, and Xho site]
Lane 6 repeats the trend of the three bands, with a conglomerate DNA cluster of 12,000 BP, a bande for the nicked circular DNA at 9,000 apparent base pairs, and a band for the Supercoiled DNA at 4,300 apparent base pairs.
Lanes 7 and 8 show the single band, of 6,900 base pairs that indicate a linearized strand of DNA resulting from the restriction digest.
Lane 9 also shows a single band of about 6,900 base pairs, despite being cut by both restriction enzymes, implying that the restriction sites for the two enzymes are at essentially the same location on the plasmid.
[Insert a drawing of the resulting restriction enzyme map of the 6,900 BP KS Plasmid, including Pst+ and Xho]
Lane 19 shows the single band that corresponds to a very small sequence of about 600 base pairs, which therefore must be the distance between the two primers used in the PCR of the chit plasmid.
The explanation for the presence of the PCR band in the Chit lane (19) but not in the KS+ lane (20) is the fact that Chit primers were used for the PCR process, and since those primers would only be present in the Chit plasmid insert, only that Chit sequence between those primers would have been amplified. This 600 base pair sequence must be part of the chit sequence that is inserted into the Multiple Cloning Site.
-Literature Cited-
(I kept these in only for examples of the citation structure.)
Garret R. H., & Grisham, C. M.. (2005). Biochemistry Third Edition. California: Thomson Brooks/Cole.
Ream, W., & Feild, K. G.. (1999). Molecular Biology Techniques An Intensive Laboratory Manual. New York: Academic Press.
Weaver, Robert F. (2005). Molecular Biology Third Edition. New York: McGraw Hill.
Grdadolnik, J., Marechal, Y., (2001).
Bovine Serum Albumin observed by infrared spectrometry. I. Methodology, structural investigation, and water uptake, Biopolymers, 62, 40-53.
Retrieved February 10, 2005, from www.ncbi.nlm.nih.gov
15 ABSTRACT THIS ESSAY CHALLENGES WHAT SARAH CARDWELL CALLS
15 ABSTRACTION AND GLOBALLOCAL PROCESSING RUNNING HEAD ABSTRACTION AND
15TIPOS ABSTRACTOS DE DATOS CAPÍTULO 17 TIPOS ABSTRACTOS DE
Tags: still, materials, methods, introduction, abstract
- SECRETARÍA DE COMISIONES HONORABLE CÁMARA DE DIPUTADOS DESPACHO N°1747
- 8 LOS CELOS POR PROFR ROBERTO DURÁN INTRODUCCIÓN
- AUTOS NUM 62008 DEMANDA ILEGALIZACIÓN PARTIDOS POLÍTICOS T R
- I CERTAMEN IBEROAMERICANO DE DIBUJO FUNDACIÓN PATRONATO DE HUÉRFANOS
- A PPENDIX 2 THIS FORM MUST BE COMPLETED IN
- ENFORCER SK–1011–SQ TECLADO DIGITAL DE CONTROL DE ACCESO INTRODUCCIÓN
- COPYRIGHT 2020 AIA MASTERSPEC FULL LENGTH 1220 PRODUCT MASTERSPEC
- H CONGRESO DEL ESTADO DE BAJA CALIFORNIA SECRETARÍA DE
- HORIZON NOMENCLATURE HORIZON NOMENCLATURE IS A SHORTHAND NOTATION TO
- TÓDALAS PERSOAS CON DISCAPACIDADE DE CALQUERA TIPO OU GRAVIDADE
- AJUNTAMENT D’ALGEMESÍ DECLARACIÓ RESPONSABLE D’AJUDES DE “MINIMIS” DECLARACIÓN RESPONSABLE
- “FUN WITH A PURPOSE” SUNSHINE PRESCHOOL (EST1986) LOCATED IN
- AUTUNNO DINAMICO PER LA DOC PROSECCO PROMOZIONE ARTE CULTURA
- ESCALA DE VALORACIÓN DE LA INCAPACIDAD CAUSADA POR DOLOR
- 5 (5) 20201202 DNR 2020382 RIKTLINJER FÖR FRISTÅENDE GRUNDSKOLA
- CONTRACTING FOR SERVICES SOME SERVICES CANNOT BE PROVIDED BY
- 4 DRAFT RESOLUTION AVIAN INFLUENZA INTERAMERICAN COOPERATION
- LEGIÓN DE MARÍA ¿QUÉ ES Y CUÁL ES SU
- QUESTIONS AND ANSWERS ON RESPONSE TO INTERVENTION AND EARLY
- SENATE AGENDA JANUARY 29 2008 U NIVERSITY SENATE AGENDA
- EECP REFERENCE BY DISEASE AND OUTCOME (PUBLISHED PAPERS)
- FORM XIV APPLICATION FOR REGISTRATION OF COPYRIGHT [SEE RULE
- TEMESEMINARSKI RAD JAVNE FINANCIJE 20132014 TEME SEMINARSKI RAD
- B LAD 45 DATUM 28 DECEMBER 2001 ONDERWERP SUIKERMUSEUM
- KATALOG ZNANJ V ODPRTEM KURIKULU NIŽJE POKLICNO IZOBRAŽEVANJE
- GRAD ŠIBENIK II IZMJENA I DOPUNA PUPA STAMBENOG NASELJA
- (LOGO EMPRESA O INSTITUCION) ACUERDO DE COLABORACIÓN ENTRE LA
- CONVOCATÒRIA MOBILITAT ERASMUS + ACCIÓ (KA107) A PAÏSOS NO
- 3 ENGLISH READINGS FOR FRIDAY EVENING SERVICES THE READINGS
- GRADE 6 MODULE 2B UNIT 3 LESSON 4 MIDUNIT
 CARLOS ARIAS CARLOS E ARIAS G TLINE 2 RADUCTOR
ZAKON O POŠTI (UREDNIČKI PROČIŠĆENI TEKST “NARODNE NOVINE” BROJ
 PROCEDIMIENTO PROYECTAR E IDENTIFICAR ESTRATEGIAS DE AMPLIACIÓN DE OFERTA
 FOTO SOLICITUD DE VISADO SCHENGEN ESTE FORMULARIO ES GRATUITO
ÚLTIMA MODIFICACIÓN (ARTÍCULO 61 FRACCIÓN VII DEL REGLAMENTO INTERNO
WORMS 4 MAYHEM MISSION GUIDE WRITTEN BY
ANUNCIOS VOCACIONALES PARA BOLETINES PARROQUIALES PRIMER DOMINGO DE ADVIENTO
RESUMEN DE LA NOTIFICACIÓN DE LA LIBERACIÓN DE PLANTAS
TEXTO CURRICULAR DE GABRIEL RODRÍGUEZ COMISARIO DE LA EXPOSICIÓN
 MASTERING PUBLIC SPEAKING LEARN PRESENTATION SKILLS THAT REDUCE
CUESTIONARIO SOBRE EL DRAMA PÁGINAS 285286 1 ¿QUÉ SIGNIFICA
 n Orthern Recycling & Waste Services llc Paradise ca
 CENTRO DE INVESTIGACIÓN CIENTÍFICA Y DE EDUCACIÓN S UPERIOR
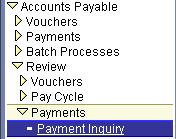 HOW TO USE PAYMENT INQUIRY STEP 1 IN THE
 PATOLOGÍA MITOCONDRIAL BQ21 DR GARESSE LA PATOLOGÍA MITOCONDRIAL TIENE
 PIOTR RYNKIEWICZ OŻKSB WĘZEŁ WARMIŃSKOMAZURSKI TWORZENIE SZABLONU PROGRAMU QDA
“LA INMIGRACIÓN EXPLICADA A MI HIJA” DEL POLITÓLOGO FRANCÉS
 DAFTAR LAMPIRAN LAMPIRAN I CONTOH FORMAT SK PPID
 BESEDILO-ELEKTRONSKE-JAVNE-DRAZBE_5-2019
 GUIA DE TRABAJO PROGRAMA INGENIERIA DE SISTEMAS CICLO DE
