ATLAS INTERNAL NOTE 30 SEPTEMBER 2005 QUALITY CONTROL RESULTS
25 JÚL 2010 KRKONOŠE UBYTOVANIE HTTPWWWUBYTOVANIATLASCESKACZHOTELSNEZKAFELICITYHOTELSPINDLERUVMLYN ODCHOD O 5306 3PIELIKUMS PROJEKTU IESNIEGUMU ATLASES NOLIKUMAM PROJEKTU IESNIEGUMU VĒRTĒŠANAS
8023524734 VTHERPATLASORG ANNUAL REPORT FEBRUARY 9 2021 BACKGROUND THE
ALMUDENA GRANDES ATLAS DE GEOGRAFÍA HUMANA © ALMUDENA GRANDES
AN ATLAS OF TRAFFICKING IN SOUTHEAST ASIA THE ILLEGAL
APSTIPRINĀTS 2012GADA 25OKTOBRA DARBA GRUPAS SĒDĒ NOLIKUMS ATLASES PROCEDŪRA
Drift properties of the ATLAS MDT chambers
ATLAS Internal Note
30 September 2005
Quality control results of the drift tubes for the ATLAS MDT-BIS chambers
T. Alexopoulos, R. Avramidou, M. Dris, T.A. Filippas, E.N. Gazis,
E. Katsoufis, S. Maltezos, P. Savva, G. Tsipolitis, E. Tzamariudaki
National Technical University of Athens, Athens, Greece
ABSTRACT
ATLAS (A Toroidal LHC ApparatuS) is a general purpose experiment, which will start its operation at the Large Hadron Collider (LHC) at CERN in 2007. The ATLAS detector is designed to study the products of proton-proton collisions at c.m.s. energies of up to 14 TeV. Three Greek Universities have taken the responsibility to construct 112 BIS-MDT (Barrel Inner Small) chambers using 29 000 drift tubes of 170 cm length and 3 cm diameter that have been quality tested before assembly. This work describes the Quality Assurance and Quality Control (QA_QC) procedures for the drift tubes, followed at the High Energy Physics Laboratory of the National Technical University of Athens, while emphasis is given on the obtained results for the above mentioned number of tubes.
1. Introduction
The ATLAS detector for the Large Hadron Collider at CERN [1] will study the products emerging from proton-proton collisions at energies up to 14 TeV. The outermost part of the ATLAS detector, the Muon Spectrometer, is designed to identify muons with high efficiency and measure their momenta with a resolution of ~10% at pT=1 TeV/c. The measurement is performed inside the toroidal field created by powerful air-core toroid magnets with the help of the ATLAS Muon precision tracking system.
The BIS drift tubes have been assembled at the University of Athens (UoA) [2], while the Quality Assurance and Quality Control (QA_QC) systems have been developed by the National Technical University of Athens (NTUA) [3]-[5]. The final assembly of the MDT-BIS chambers was under the responsibility of the Aristotle University of Thessaloniki (AUTH) [2]. The MDT-BIS chamber consists of two multilayers composed of four layers each. Each layer consists of 30 aluminium drift tubes 1700 mm long. The multilayers are separated by seven 6 mm thick aluminium strips. The basic detection element of the MDT chambers is a precision aluminium drift tube of 30 mm diameter and 400 μm wall thickness, with a 50 μm diameter gold-plated W-Re anode wire. The design of the muon drift tubes aims at high detection efficiency more than 95% and a spatial single tube resolution of less than 80 μm [5], [6].
The QA_QC project focuses on the study, design, development, installation and operation of the necessary infrastructure for the monitoring of the quality of the drift tubes during the mass production phase. It also includes the automation of the QA_QC procedure and the analysis of the corresponding measurements. The quality assurance and quality check tests performed at NTUA are the following:
Wire tension measurement
High voltage leakage current measurement
Wire position measurement
Gas Leak rate measurement
The tubes must fulfill the following requirements [1]:
A wire tension within ±15 gf of the nominal value of 350 gf at the nominal temperature of 20 ºC
A leakage current of at most 2 nA/m (3.4 nA in our case) at a high voltage of 3.4 kV and with the gas mixture Ar:CO2 (93:7).
A wire location with respect to the centre of the reference surface of the endplug, less than 25 μm in each transverse coordinate.
A leak rate less than 10-8 bar·l /s.
All the measurement results are stored in a Microsoft AccessTM database, available at the NTUA home page [7].
2. Wire tension measurement
The purpose of this measurement is the limitation of the wire gravitational sag and the oscillations due to the electrostatic forces. The gravitational sag of the wires has to be controlled within a tolerance of ±10 μm in order to know the wire position between the tube ends with sufficient accuracy. The estimation of the gravitational wire sag is based on the measurement of its mechanical tension.
The wire tension of the tube is measured with a wire stretch meter provided by CAEN (type SY502) [8]. The operation principle is the following. The tube wire is excited by a square current pulse. The middle (of a length of 10 cm approximately) of the tube is located inside a magnetic field produced by a permanent magnet (55 mm×45 mm×60 mm) made by Alcomex. The magnetic force makes the anode wire to vibrate. The wire vibration inside the magnetic field produces an induced electromagnetic force on the wire, which is detected by the stretch meter. A feedback mechanism keeps the wire in sustained oscillations. As the excitation takes place in the middle of the wire, the fundamental frequency dominates.
The meter measures the
fundamental frequency of the sustained oscillations (i.e. the
fundamental frequency of the free vibration). The microprocessor of
the stretch meter determines the mechanical wire tension F from the
oscillation frequency
![]() of the fundamental mode wire vibration, based on the expression
of the fundamental mode wire vibration, based on the expression
![]()
where
![]() =19.3
g/cm3 is the density of the wire material,
=19.3
g/cm3 is the density of the wire material,
![]() =50
μm is the wire diameter and
=50
μm is the wire diameter and
![]() =165
cm is the wire length.
=165
cm is the wire length.
The CAEN module is connected
to a PC and controlled by LabVIEWTM through an RS232
connection. The calculation of wire tension F is also done within the
LabVIEW programme, based on the above input data, with more
significant digits than the meter accepts. As the accuracy of the
wire data (e.g.
![]() =50±5
μm) is limited, it is wise to refer to
the vibration frequency too.
=50±5
μm) is limited, it is wise to refer to
the vibration frequency too.
The set-up of the wire tension meter (magnet and CAEN module) has been checked and verified by a calibration system designed at the NTU. The calibration system is based on an accurate and horizontal stand. In that stand a similar anode wire of the same length (165 cm) has been stretched with a highly accurate weight of 350 g increased by an additional accurate weight of 100 g, applied only for a few minutes. The measured wire tension with the above mentioned CAEN module and magnet, of the calibration system fits the applied weight within the error less than 1%. The measurements have been extended by applying oscillation frequencies to the wire of second and next order mode and/or of different shape pulses. Additionally the operation of the CAEN module has been checked and confirmed at NTU. More specifically its electronic circuit was calibrated with an individual simple home made electronic device that provides a very well stabilized square waveform of 50 Hz.
The obtained measurements of the wire tension and frequency normalized to the nominal temperature of 20 ºC are presented in Fig. 1 and in Fig. 2 respectively. The wire tension has a mean value of 342.2 gf (gram-force=9.80665 mN) and 3.7 gf r.m.s, while the frequency has a mean value of the 91.1 Hz and 0.5 Hz r.m.s. Tubes showing a ± 5% variation or greater with respect to the mean value have been rejected. They correspond to 0.2% of the sample.
3. High voltage leakage current measurement
The HV leakage current measurement aims to the limitation of the leakage current from the anode wire to the cathode through the endplugs, which can cause electronic noise and destruction of the drift tube.
The measurement is done as follows. The tube is filled with the gas mixture Ar:CO2 (93:7) at 3 bar absolute pressure and then HV is applied up to 3400 V. The voltage drop across a resistor of 1 MΩ, connected in parallel with an electrometer, namely Keithley 614 or the multimeter Keithley 2000 is measured.
The resistor is connected on the ground side and we measure the mirror current. The use of the ground side has the advantage that one can easily use a PC with an ADC card of good quality to measure many tubes simultaneously. Another factor is safety, and the third is the fact that if one uses a voltmeter that gets power from the mains, it cannot have any of its probe wires with more than 500 V from ground. With the 1 MΩ resistor, 1 mV voltage drop corresponds to 1 nA current through the resistor.
The tubes with large leakage currents are put in reversed voltage. This procedure cures the great majority of "bad" tubes.
Measurements of HV leakage currents are presented in Fig. 3. The mean value is 0.7 nA. Only 0.1% of the tested tubes had a current higher than the limit of 3.4 nA and hence have been rejected.
4. Wire position measurement
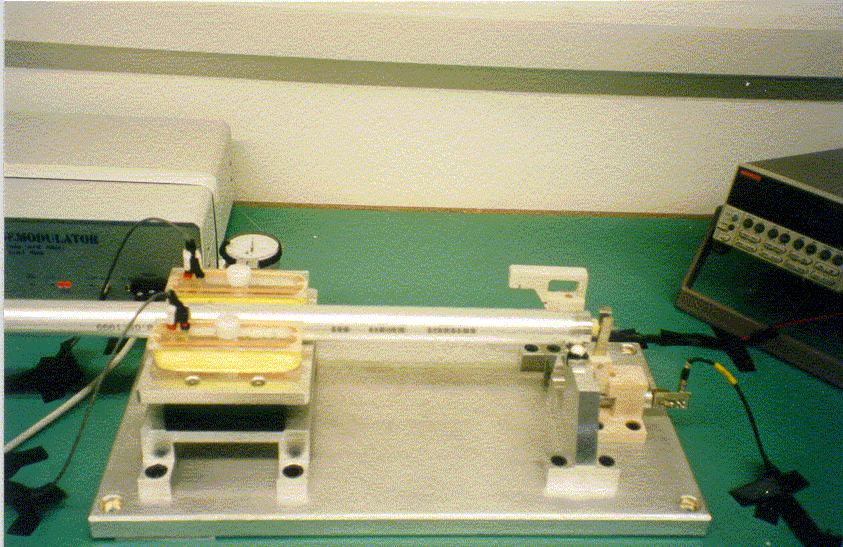
An important parameter for the track reconstruction in the muon spectrometer is the accuracy of the location of each wire with respect to the tube axis. For this purpose we used an electromagnetic micrometer, EMMI [9]. The EMMI device (Fig. 4), consists of two fixed V blocks, on which the tube end-plug precision surfaces are supported, two pairs of movable coils, near the V blocks, a signal generation board, which provides the tube wire with an oscillating current and two readout boards, which read out the signals induced on the coils. This device can measure the wire position by comparing the signals induced on the pairs of the coils positioned on either side of the drift tube [9].
During the measurement procedure, the tube is placed on the two V shaped precision supports between the coils and it is rotated around the endplug axis. The signal is recorded for 4 equidistant angular positions (0°, 90°, 180° and 270°). The wire offset is calculated from the above measurements and the calibration measurements. The wire displacement is found with an accuracy of 2 μm. The output voltages are read with voltmeters and transferred through an ADC card to a PC (LabVIEW code).
We tested our system in terms of consistency of the two sets of coils. For this purpose we used several tubes and measured each of their ends with the two different coil pairs. The obtained results differed in all cases by less than 1.2 μm.
Adjustments on the electronic part of the EMMI setup (signal generation board and read-out board) for its proper operation were done in our laboratory. The system was also calibrated and position calibration factors, which relate the measured signal in mV and the displacement of the wire in micrometers, were determined. These factors have been obtained using two mechanical gauges (MITUYOMO dial indicator), a dial indicator device mounted to each coil and changing the position of the coils relative to the position of the tube wire. Taking measurements at twenty different positions we can find the position calibration factors for each end of the tube.
We also tested the effect of eddy currents on the measurements. Eddy currents produce signals 90° out of phase relative to the real (initial) signals and because of that, their effect is reduced due to the way the lock in technique works as long as the system is well adjusted. To test this effect we used a wire without a tube and measured the displacement versus voltage to estimate the calibration constants. We found that the calibration constants for the two respective ends were the same as the ones for the case of the tube, within an error of less than 1%. An additional measurement was done by fixing a wire surrounded by a tube without end-plugs. The tube was fixed to the coils. The calibration constants were measured, while the tube and the coils were displaced. The new constants were the same as with the normal case of the tube, with an error of the order of 2% to 3%. Based on these measurements we concluded that no eddy current correction is needed for our system.
Results for the wire position measurement are presented in Figs 5 and 6. There were no rejected tubes.
Gas leak rate measurement
The purpose of this measurement is the verification that the tube can keep a constant pressure and the back diffusion prevention of the electronegative elements Ο2 and N2 into it.
The experimental setup we developed allows the measurement of the average gas leak rate through the whole body of the tube (endplugs and cylindrical surface). The gas leak method is based on the pressure drop after a time interval. The system pressure is compared with the pressure of a reference tube using a differential manometer with a 0.024 mbar precision. The two lines of the differential manometer are connected with the reference tube and the tube under test.
There are two systems of 50 drift tubes each filled with Ar:CO2, (93:7) at 3 bar absolute pressure. This method is sensitive to the temperature stability and uniformity along the tubes under test and the reference tube. For this reason specific thermally insulated boxes have been constructed to enclose the system of tubes. The temperature difference variations at the edge points of the boxes are 0.1 °C. The room temperature is controlled and known with a precision of ±0.5 °C. The temperature variations in the air conditioned room within a time period of 1 hour are reduced by a factor of 5 inside the box. The problem of the sensitivity in temperature variations has been surmounted using a monitoring system and an autocompensation technique. Absolute calibration of the setup has been done using appropriate capillary tubes.
The procedure is the following. After mounting and filling with gas, the tubes are kept under pressure for 12 hours for temperature stabilization. The initial pressure and temperature are recorded, while the pressure drop is measured after 2-3 days. Keeping the tubes under pressure for 12 hours is crucial not only for the temperature stabilization issue but also because we have observed that during this time interval we have the highest leak rates. A possible explanation for this observation is that the gas molecules occupy the material cavities and create a ‘fake’ gas leak. Moreover the measurement duration of 2-3 days reduces substantially the measurement error (Fig. 7). The data for the tubes and differential manometer temperatures (Fig. 8) as well as the differential manometer pressure are taken with a LabVIEW program. The method is described in detail in [3].
The gas leak rate is![]() ,
where
,
where
![]() is the pressure drop and
is the pressure drop and
![]() the tube volume. The gas leak measurement results are presented in
Fig. 9. The mean value is 0.810-8
bar×l/s
with an r.m.s. 0.210-8
bar×l/s.
Only 0.5% of total number of tubes have been rejected having leaks
larger than 1.210-8
bar×l/s.
the tube volume. The gas leak measurement results are presented in
Fig. 9. The mean value is 0.810-8
bar×l/s
with an r.m.s. 0.210-8
bar×l/s.
Only 0.5% of total number of tubes have been rejected having leaks
larger than 1.210-8
bar×l/s.
6. Conclusions
The description of the Quality Assurance and Quality Control (QA_QC) procedures for the Monitored Drift Tubes, which were followed at the HEP Laboratory of NTUA are presented and the corresponding results of the tested tubes are given. All the phases from study, design, development, installation and operation of the necessary infrastructure up to the automation of the QA_QC procedures for the mass production scale have been discussed. Only a very small fraction (<0.5%) of the tested tubes have been rejected because they didn’t meet the ATLAS requirements.
7. Acknowledgments
This work has been performed within the ATLAS Collaboration, and we thank several collaboration members for helpful discussions and especially Prof. W. Blum. We are grateful to Prof. V. Polychronakos and Prof. H. Wellenstein for useful discussions and supporting the differential manometers and the capillary tube. We would like to acknowledge the excellent work done by Mr K. Razakias and Mr P. Kremizis, of the Technical Staff of NTUA Physics Department, on the construction of the special parts of the piping system and thermally insulated boxes.
This work has been done in the framework of the project “PYTHAGORAS I”, which is co-funded by the European Social Fund (75%) and National Resources (25%).
8. References
ATLAS, Muon Spectrometer, Technical Design Report, CERN/LHCC/97-22, ATLAS TDR 10, 1997.
F. Bauer et al, "The First Precision Drift Tube Chambers for the ATLAS Muon Spectrometer", ATL-MUON-2001-004, (MPI-PhE/2001-03), 28 Feb 2001, Nucl. Instrum. Meth. A478 (2002), pp 153-157.
T. Alexopoulos et al, "Gas Leak Rate Measurement System for the ATLAS MUON BIS-Monitored Drift Tubes" SN-ATLAS-2002-016, CERN, 20 Oct 2001, Nucl. Instrum. Meth. A521, vol. 521, Issues 2-3, 1 April 2004, pp 332-342.
Th. Alexopoulos et al, "A Quality Assurance and Quality Control (QA_QC) Procedure of the Monitored Drift Tubes (MDT) for the BIS-Chambers of the ATLAS Muon Spectrometer", IEEE Trans. Nucl. Sci. and Nucl. Instrum. Methods, October 2002, vol. 49, Number 5, pp 2484-2487.
R. Avramidou, "Quality Control and Study of the Physical and Technical characteristics of the Muon Drift Tubes and Chambers for the Muon Detection at the experiment ATLAS/LHC", PhD thesis.
T. Alexopoulos et al, "Extensive Performance Studies for the ATLAS BIS-MDT Precision Muon Chambers", IEEE Trans. Nucl. Sci., December 2003, vol. 50, Number 6, pp 2420-2425.
"http://www.physics.ntua.gr/hep/atlas/".
CAEN SY 502 User’s Manual
M. Cambiaghi et al, "An electromagnetic micrometer to measure the wire centering in high-resolution aluminum drift tubes", IEEE Trans. Nucl. Sci., June 2000, vol. 47, pp 784-788.
Figures
|
|
|
|
Fig. 1. Anode wire tension test results. |
Fig. 2. Anode wire frequency test results. |


|
|
|
Fig. 3. HV leakage current test results. |

|
|
|
Fig. 4. The V block, on which the tube endplug precision surface is supported and the pair of the movable coils are visible. |
|
|
|
Fig. 5. The anode wire position measurements for the z and y coordinates for the two ends of each tube (zA, yA, and zB, yB). The r.m.s. is below 5 μm. |

|
|
|
Fig. 6. The anode wire position measurements for the z and y coordinates for the two ends of each tube (zA, yA, and zB, yB). |

|
|
|
Fig. 7. Measurement of the ratio dL/L(%) for the gas leak rate. The horizontal line shows the upper limit. |
|
|
|
Fig. 8. Temperature differences between a drift tube and the reference tube. |
|
|
|
Fig. 9. Gas leak test results. |

APSTIPRINĀTS DAUGAVPILS PILSĒTAS DOMES AMATU PRETENDENTU ATLASES KOMISIJAS 2020GADA
ATLAS LAR CALIBRATION SYSTEM N MASSOL G DAGUIN
ATLAS A TLAS MUON MDT MROD ONBOARD SOFTWARE DESCRIPTION
Tags: atlas internal, the atlas, september, quality, results, control, internal, atlas
- !DOCTYPE HTML ![IF IE 8]HTML CLASSNOJS LTIE9 LANGEN
- ESO 1 REFERENCE AND TITLE OF THE HARMONISED STANDARD
- 10 KYBARTŲ PATAISOS NAMAI TVIRTINU DIREKTORIAUS PAVADUOTOJAS ATLIEKANTIS DIREKTORIAUS
- 3gpp ts 32615 V910 (201006) Technical Specification 3rd Generation
- EXPERIMENT 9 THE RL SERIES CIRCUIT THE VOLTAGE AS
- AL DEPARTAMENTO DE SALUD DE CON DNI MÉDICO EN
- PROGRAMA VII JORNADAS MANRIQUEÑAS EN VILLAMANRIQUE (CIUDAD REAL)
- WNIOSEK O ODBYCIE PRAKTYKI ZAWODOWEJ I WNOSZĘ O ODBYCIE
- PRAVILNIK O TEHNIČKIM NORMATIVIMA ZA HIDRANTSKU MREŽU ZA GAŠENJE
- VERSION 1 BEST PRACTICES FOR TRAUMA AND ADDICTION
- Convenio Marco de Colaboración Entre el Instituto Tecnológico de
- EAT YOUR COLORS IT’S IMPORTANT TO GET A COLORFUL
- TERMINARZ ROZGRYWEK LIGI PODHALAŃSKI KLASA OKRĘGOWA GRUPA 2 RUNDA
- RELACIÓN ACERCA DE LAS ANTIGÜEDADES DE LOS INDIOS NOTAS
- Wzór Wniosek o Dofinansowanie z Funduszu Wyprawowego Fundacji Wspierania
- TC ÜSKÜP BÜYÜKELÇİLİĞİ TİCARET MÜŞAVİRLİĞİ 28082018 MAKEDONYA ENERJİ SEKTÖRÜ
- WWWRECURSOSDIDACTICOSORG E L SISTEMA INTERNACIONAL DE UNIDADES (SI) EN
- STUDENT STUDY TEAM RED FOLDER PROCESS EARLY INTERVENTION FOR
- IMPACT OF POPULATION AGEING IN NEW ZEALAND ON THE
- 3 ZAŁĄCZNIK DO UCHWAŁY NR II050405 Z DNIA 12
- ZAŁĄCZNIK NR 3 UL SIENKIEWICZA 53 25002 KIELCE TEL
- WYDAWNICTWO ESTRELLA PLAN ROZWOJU FIRMY W PIERWSZYCH PIĘCIU LATACH
- 2021 TRACK AND FIELD NATIONAL HONOR ROLL — GIRLS
- DIRECTIONS CHECK THE BOX NEXT TO THE SKILL AREA(S)
- 1ER ENCUENTRO DE AUTORES ANTIGUOS ALUMNOS NEIL ARMSTRONG Y
- A TEXTOVÁ ČÁST STUDIE NOVÝCH PARKOVACÍCH MÍST –
- act on Appending two Paragraphs to Article 7 of
- • PEGA PAPEL PLATINO EN LA VOCAL “A” Y
- FICHE ENSEIGNANT – CYCLE 3 – L’HISTOIRE DE LA
- Persian Student Association (psa) Constitution Article i Name
 PROPOSED PLAN FOR IMPLEMENTING THE COMMUNITY FIRST CHOICE OPTION
HTTPWWWBERRIAINFOTESTUAIKUSIPHP?SAILAPLAZA&DATA20061219&ORRIA051&KONT005 20061219 525 HITZ GOGO FALTA? DESIO FALTA EZ
 Cahps® Nursing Home Survey Version Discharged Resident Instrument Language
 FULL SERVICE QUALITY FRAMEWORK SELFASSESSMENT GUIDANCE AND INFORMATION FOR
SÍNDICSSÍNDIQUES – DEFENSORSDEFENSORES LOCALS SÍNDICOSSÍNDICAS – DEFENSORES DEFENSORAS
MONDAY TUESDAY WEDNESDAY THURSDAY FRIDAY CONSULTS 800 815
 PODROBEN OPIS VSEBINE IZOBRAŽEVANJA ZDRUŽEN S PREDSTAVITVIJO Z IZOBRAŽEVANJA
 SUELLEN MARTINS LOPES SANTOS BRASILEÑA SOLTERA FECHA DE NACIMIENTO
DRUGS AUSTRALIA IS A DRUGUSING SOCIETY THE MOST COMMON
 I NTERNALLY DISPLACED PERSONS HEALTH AND WHO INTERNALLY DISPLACED
 ASSEMBLY NO 1914 STATE OF NEW JERSEY 215TH LEGISLATURE
 2 P RESS RELEASE JANUARY 2019 PRESS CONTACT
 UNIVERSIDAD SALESIANA DE BOLIVIA INGENIERÍA DE SISTEMAS PLAN DE
 2004 JOINT WTOOECD REPORT ON TRADERELATED TECHNICAL ASSISTANCE AND
LANCING FOOTBALL CLUB CULVER ROAD LANCING WEST SUSSEX BN15
 APPLICATION FOR EMPLOYMENT (PLEASE COMPLETE FULLY IN BLACK INK)
 DMCCOUNCIL MEETINGF212018 25TH MAY 2018 MINUTES OF THE COUNCIL
 SECRETARIA DE ESTADO DA SEGURANÇA PÚBLICA POLÍCIA CIENTÍFICA EDITAL
SOLICITUD DE BECA PROGRAMA DE PASANTIAS 2014 PARA TÉCNICOS
 ES RESUMEN EJECUTIVO DEL STUDIO LAS NUEVAS ACTITUDES HACIA
