P BURNLEY 1192021 EXAMPLES OF HANDS ON ACTIVITIES I
BURNLEY BOROUGH COUNCIL JOB DESCRIPTION POST APPRENTICE GARDENERBURNLEY BOROUGH COUNCIL SELECTIVE LICENCE CONDITIONS IN THESE CONDITIONS
MRS TRACY CHAN 27 WHALLEY ROAD READ NR BURNLEY
P BURNLEY 1192021 EXAMPLES OF HANDS ON ACTIVITIES I
Examples of Hands on Activities
P. Burnley
Examples of Hands on Activities
I use hands on explorations and activities in order to engage students in learning. Most of these activities that I use are adapted from activities that I have seen in written up in educational journals or middle school curriculum materials. Here are a few examples:
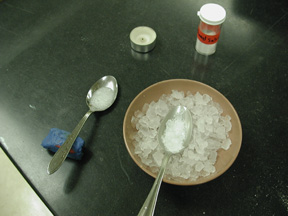
Crystallization of phenyl salicylate
|
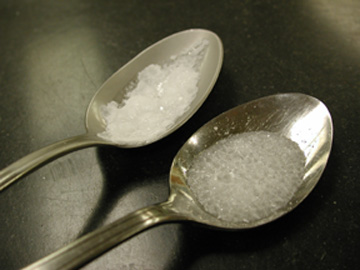
This activity illustrates the effect of cooling a melt at different temperatures on grain size. Each group of students is given several spoons, a bowl of ice, a candle, matches and phenyl salicylate (salol) – an organic compound that melts at 40C. The students use the candle to melt the salol and then observe the crystallization of the salol in a spoon sitting on ice and a spoon sitting on the table. If the spoons are clean, the two spoons develop very different grain-sizes; as can be seen below. The analogy is then drawn |
|
|
with igneous rocks. Depending on the level of the class, I can go into detail about nucleation and growth rates or I can leave the analysis quite simple. In either case the beauty of this |
|
|
|
demonstration is that the students can watch crystals growing in a melt. Students also see that the difference in grain size is caused by radically different nucleation rates rather than the common misconception that the crystals “ran out of time to grow” (which is only true for volcanic rocks containing significant amounts of glass). I have used versions of this activity in introductory classes, teacher education classes as well as in Mineralogy classses.
|
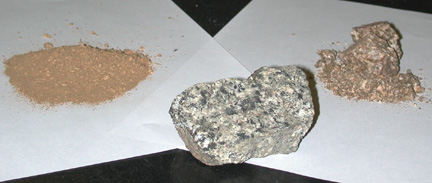
Weathering of Boulder Creek Granodiorite
I developed this activity for a teacher education workshop that I lead for the St. Vrain Valley School district in Longmont, CO. I use this exploration as an introduction to chemical and physical weathering. Each group of students is given a paper bag that contains samples of granodiorite from the Boulder Creek Batholith (Boulder, CO). Each sample represents different degrees of weathering – a relatively fresh piece, some friable, highly weathered rock and a sample of the soil developed on the
|
batholith. Students are not told what the materials are but asked to work in teams and make observations, and in some classes, to identify the minerals present in each sample. Once the students have made their observations, a collective list of observations is made on the board. At this point I ask the |
|
students to speculate on the genesis of the samples. Then we compare the mineralogy, as well as changes in texture and color across the three samples. Students are able to observe that the ferromagnesian minerals present in the granodiorite are largely missing in the weathered samples in contrast to the feldspar and quartz. More experienced students will notice that there is clay in the soil sample and the color change and decrease in particle size are obvious to all. These observations allows for a fairly in depth conversation about weathering reactions but can also be handled at a very qualitative level.
Jars of mud and sand
|
|
I use this exploration as an introduction to sediment transport and sorting. Pairs of students are given mason jars containing gravel, sand, clay and water. The jars have been mixed and allowed to settle so they contain size sorted layers of sediment and clear water. The students are asked to make notes about their jar along with a sketch. Then they are asked to vigorously shake and swirl the jar. The students observe the motion of the sediments in the jar and the way in which the sediment accumulates at the bottom. |
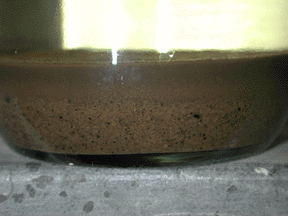
At the end the students compare their initial sketch to the final state of the jar and notice that the clay fraction is still suspended in the water. This leads us to discussion of the relationship between water velocity and the size of particles that can be carried, the process of sediment sorting and the formation of shales, sandstones, and conglomerates.
Soil Exploration
Students are asked to bring several cups of soil from their backyard (or another familiar location) to class. If possible they are to collect their soil shortly before class starts and to store it in a paper bag so any small invertebrate life forms included won’t suffocate. Like many other activities this activity has shorter and longer versions. The longest version runs over two 90 minute periods. The shorter versions can be completed inside a 75 minute period. The students are asked to observe and analyze their soil in a variety of ways. They use magnets and hand lenses to examine the mineralogy of the soil, they use a jar and water to wash the constituents of the soil apart and then attempt to classify their soil based on the thickness of the layers that developed. They conduct a finger assessment and compare the results of this method of classification with the classification that resulted from the analysis of layer thickness. The students determine the pH of their soil with and without the addition of powdered limestone and they create a berlese funnel using paper cones, paper cups, bits of screen and alcohol. I provide binocular microscopes and pictures of common soil fauna to help them identify any insects or other invertebrates that are caught by the berlese funnel.
Rivers Exploration
|
|
This is an activity that I use as an introduction to rivers and landforms. It was originally based on the Lawrence Hall of Science GEMS “River Cutters” activity for grades 6-8 grades but I have modified it so that it is more rigorous and produces more realistic landforms. Students are given a stream table containing damp diatomaceous earth (DE), spoons, gloves, sponges, and a spray bottle with water. The students observe patterns of erosion and deposition and the nature of the landforms that develop when water is sprayed on the DE. I structure this activity as a guided inquiry. I let the students muck about in an unstructured way for a while and then I ask them to build a landscape (usually a cliff) and predict how |
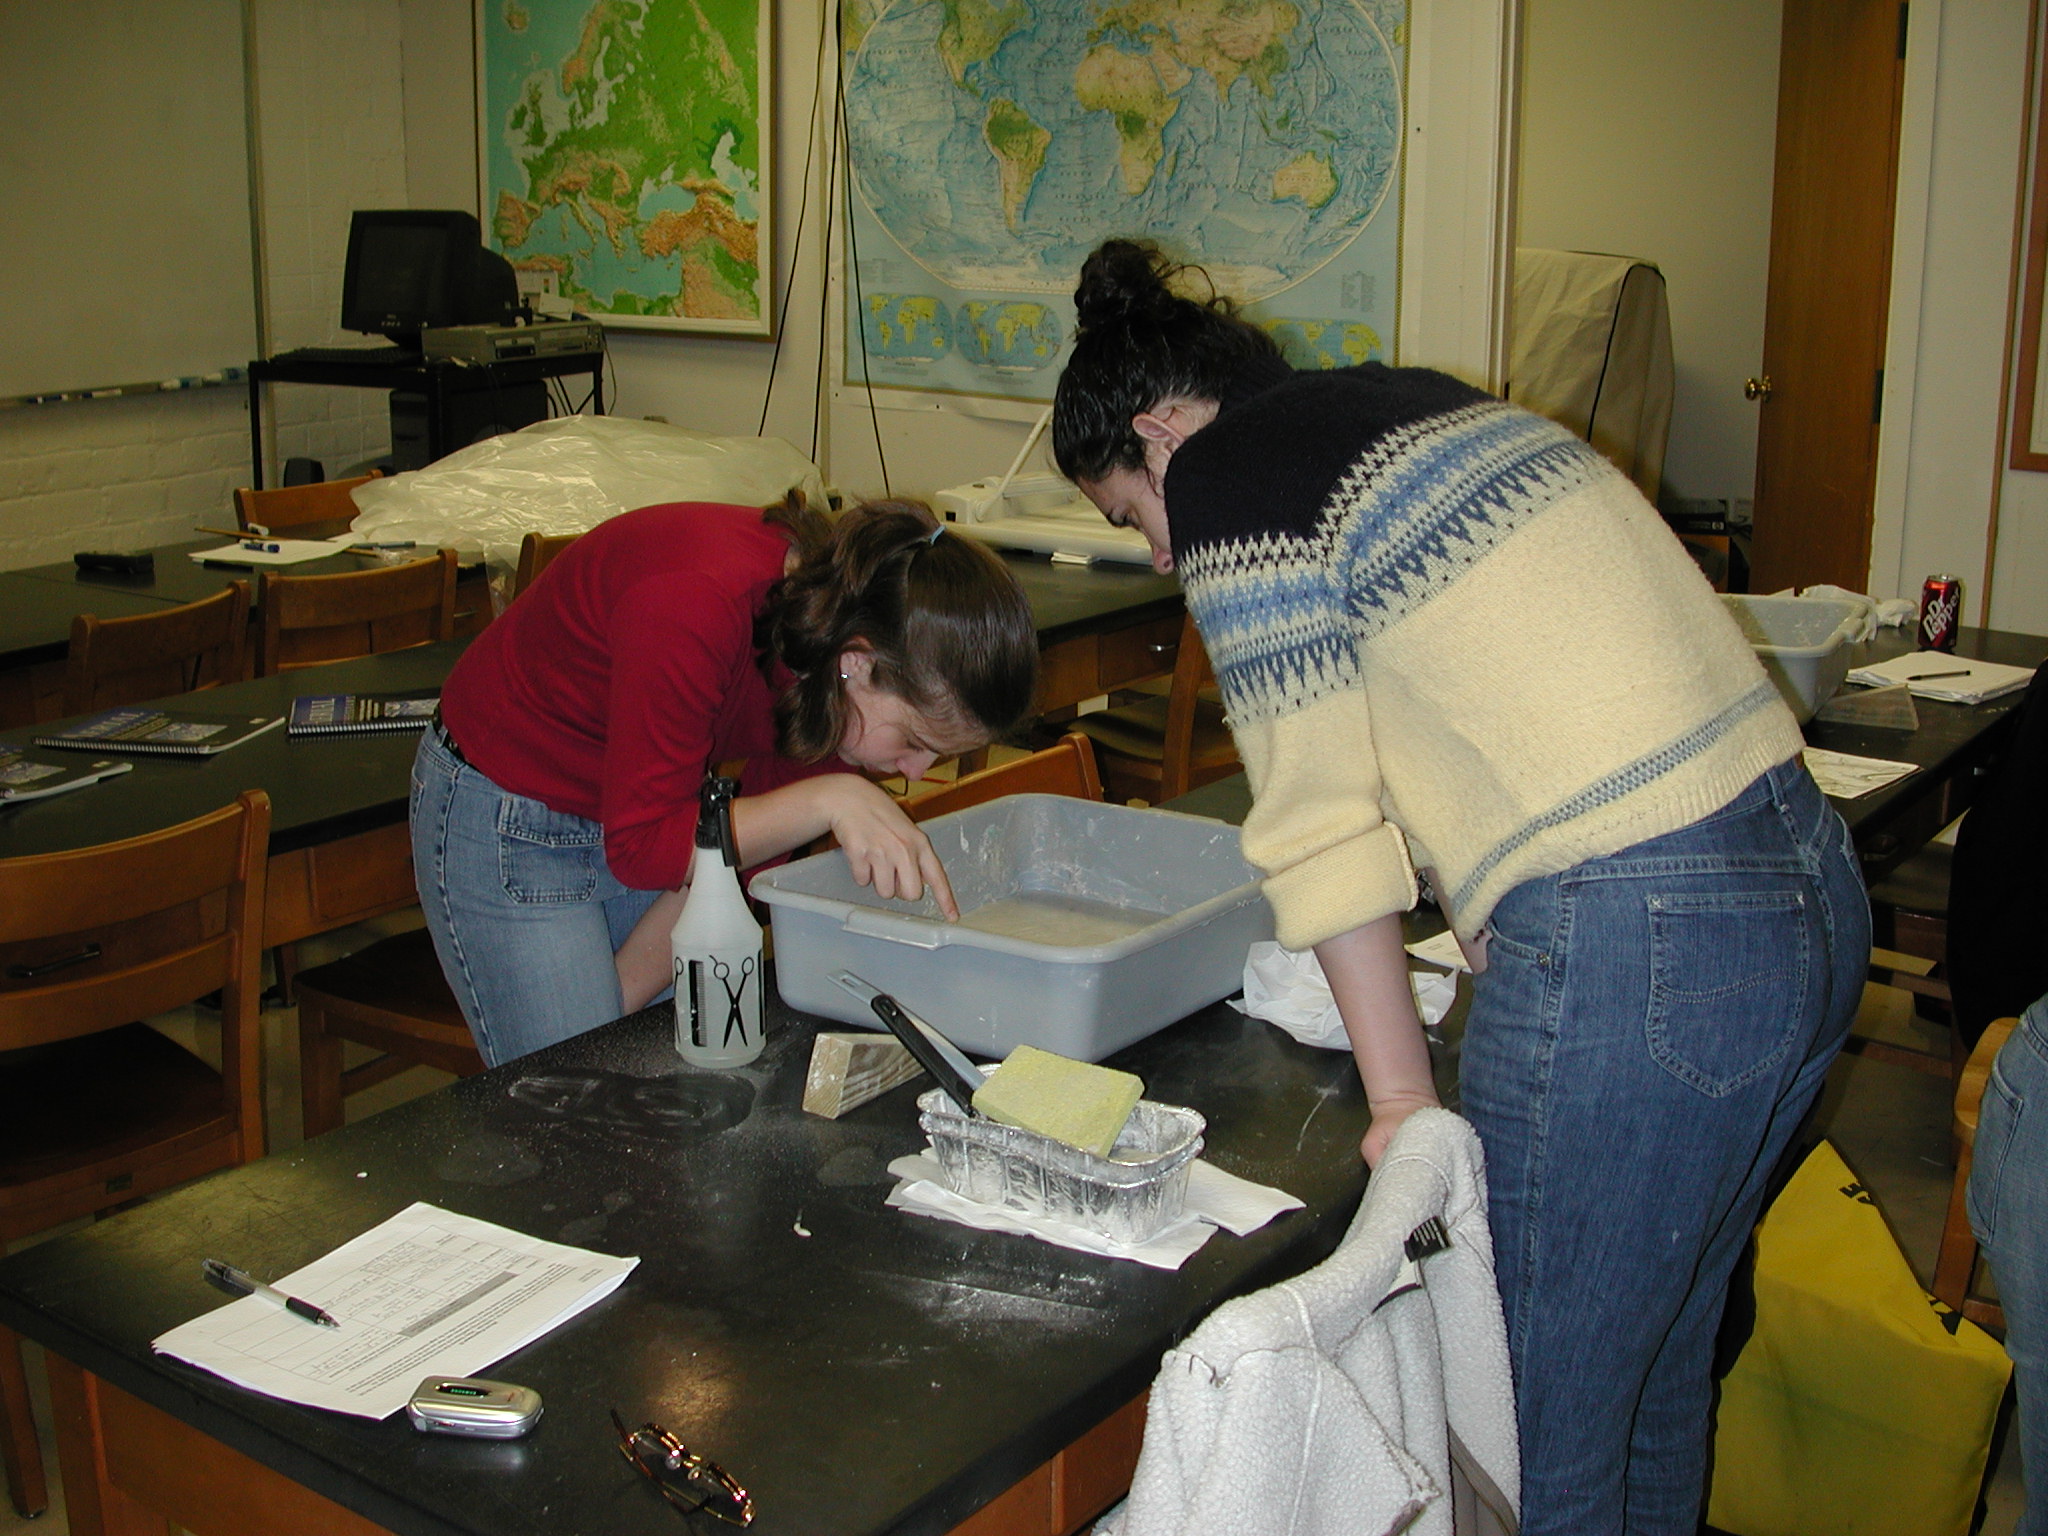
erosion and deposition will alter the landscapes. They record their predictions on a worksheet and then observe what actually happens in the stream table.
|
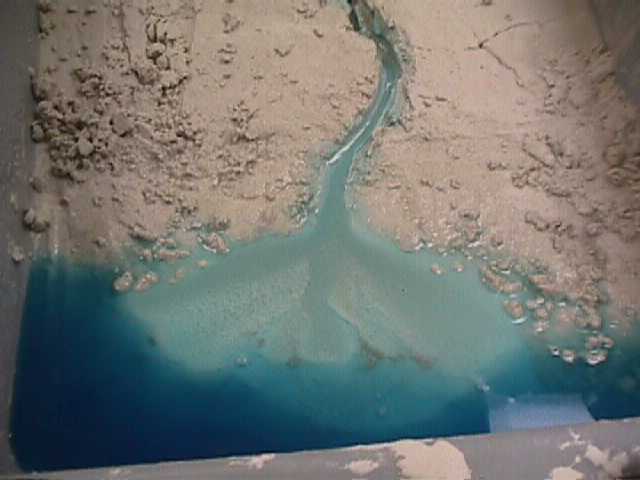
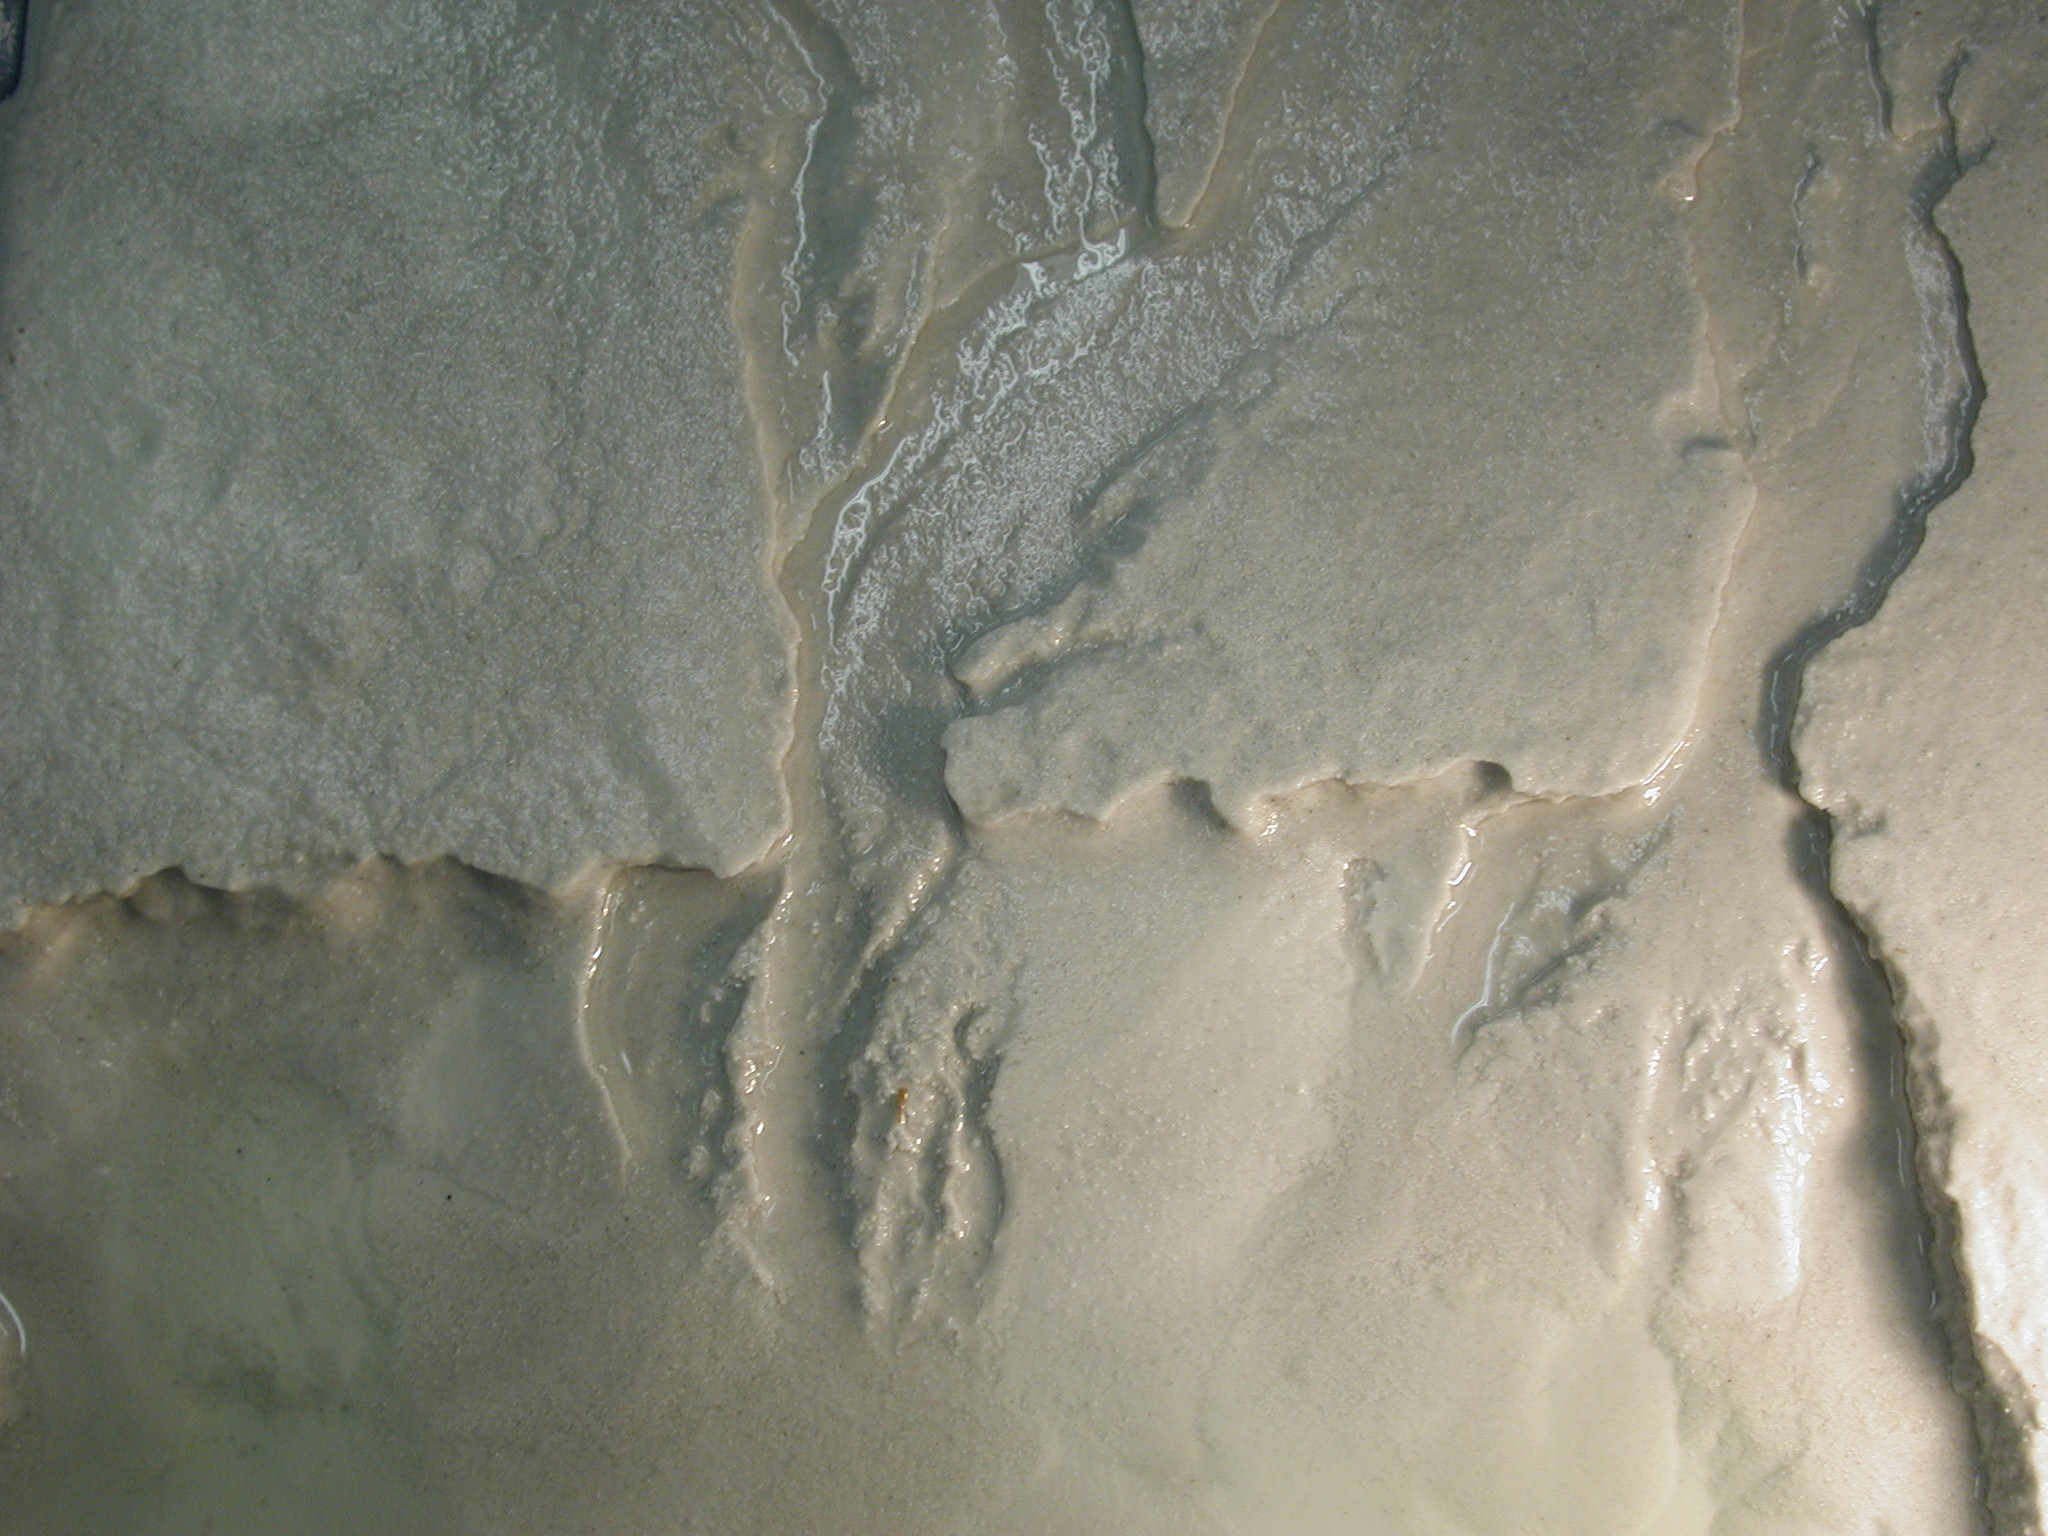
Depending on the length of time I have to devote to the activity, I will give the students a number of different things to investigate. By tipping the pans slightly and sponging water out of the bottom end, the stream gradient and base level can be altered (producing features a variety of incised features as seen below). Very rapid delivery of water to the DE generates mudflows. A table that sits quietly for several minutes will develop |
|
|
|
|
intricate dendritic drainage patterns as well as cavities at the base of steep slopes generated by ground water erosion. The DE also exhibits a variety of other interesting mass wasting behaviors and can be used to demonstrate liquefaction. Usually, the activity ends with students searching for and identifying particular landforms (e.g. a delta) in their stream tables with the aid of a collection of aerial photographs. |
|
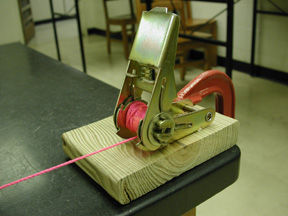
Earthquake Machine
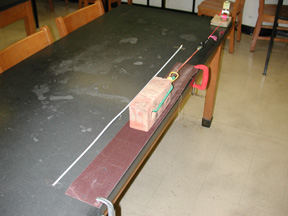
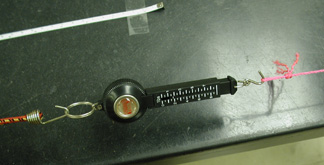
This activity is described in an article by Hall-Wallace (1998; JGE, v. 46, p. 439-449). I use this activity to help students understand why the exact time and place of earthquakes can not be predicted and to illustrate the types of boundaries that we can place on the probability of an earthquake occurring in a given location. The demonstration consists of a brick that is dragged across a strip of sandpaper by a small winch. The winch is connected to the brick by a bungee cord and a fish scale. A ruler is taped to the table beside the sandpaper to allow the position of the brick to be measured. The fish scale is used to measure the tension in
|
|
the bungee cord that is pulling the brick. Usually I have three to five students work on the activity together. I tell the students to imagine that they are geologists in charge of predicting earthquakes in California. When the brick moves an earthquake has occurred. Their goal is to understand enough about how the brick behaves to tell the citizens of California what to expect. The brick is initially placed on the far end of the sand paper. The students slowly increase the tension on the bungee cord with the winch until |
|
|
the brick slips. Students record the brick’s position and the tension in the bungee cord before and after the slip event. The brick is moved along the sand paper in this fashion until it reaches the far end of the sandpaper at which point the experiment can be repeated. I have used a variety of structures for getting the students to think about the data. For a very simple intuitive treatment, I have given students pinto beans for play money and then allowed them play a betting game based |
|
|
on whether the brick will slip on not after each click of the winch. In contrast I have also had the students carefully record all of their slip events and make graphs of force drop versus
|
|
displacement, force versus position and a histogram of event size. These graphs are then used to discuss the concepts of time predictable (earthquake occurs at a critical stress), slip predictable earthquakes (stress state always returns to same level after earthquake) and characteristic earthquakes (at constant slip rate, earthquakes will occur with a characteristic frequency). |
Discovering Plate Tectonics
Students are given maps of earthquakes foci (color coded by depth), a color relief map of the topography and bathymetry of the world, a map of the distribution of volcanoes, and a map showing the ages of the ocean floor. They are asked to examine the maps and then develop two categories for the earth’s surface. Some students suggest land and sea, but most come up with active and inactive – which allows me to introduce the concept of plates and plate boundaries. The students are then asked to break the active regions into several categories. Some will notice that deep earthquakes and volcanoes go together, some will notice broad correlations between extreme topography and active regions. Student observations are compiled on the board which leads to a discussion of each of the three types of plate boundaries. Students are then given a blank map of the world and symbols for each of the plate boundaries types and asked to draw on the map where each type of plate boundary occurs – without copying from the book. I do not expect them to get it entirely correct, but to get the general idea.
Paper Plate Boundary
This demonstration is based on a more complex demonstration that I saw as an undergrad. At that time the plates were controlled with rollers. By using pencils and cardboard I could make lots of them so each group of students could have their own set up. The demo allows students to visualize the displacement on a transform fault linking two ridge segments and it allows them to see why there is no displacement on a fracture zone. One of my goals in designing this demo was to create something that could be constructed
|
|
|
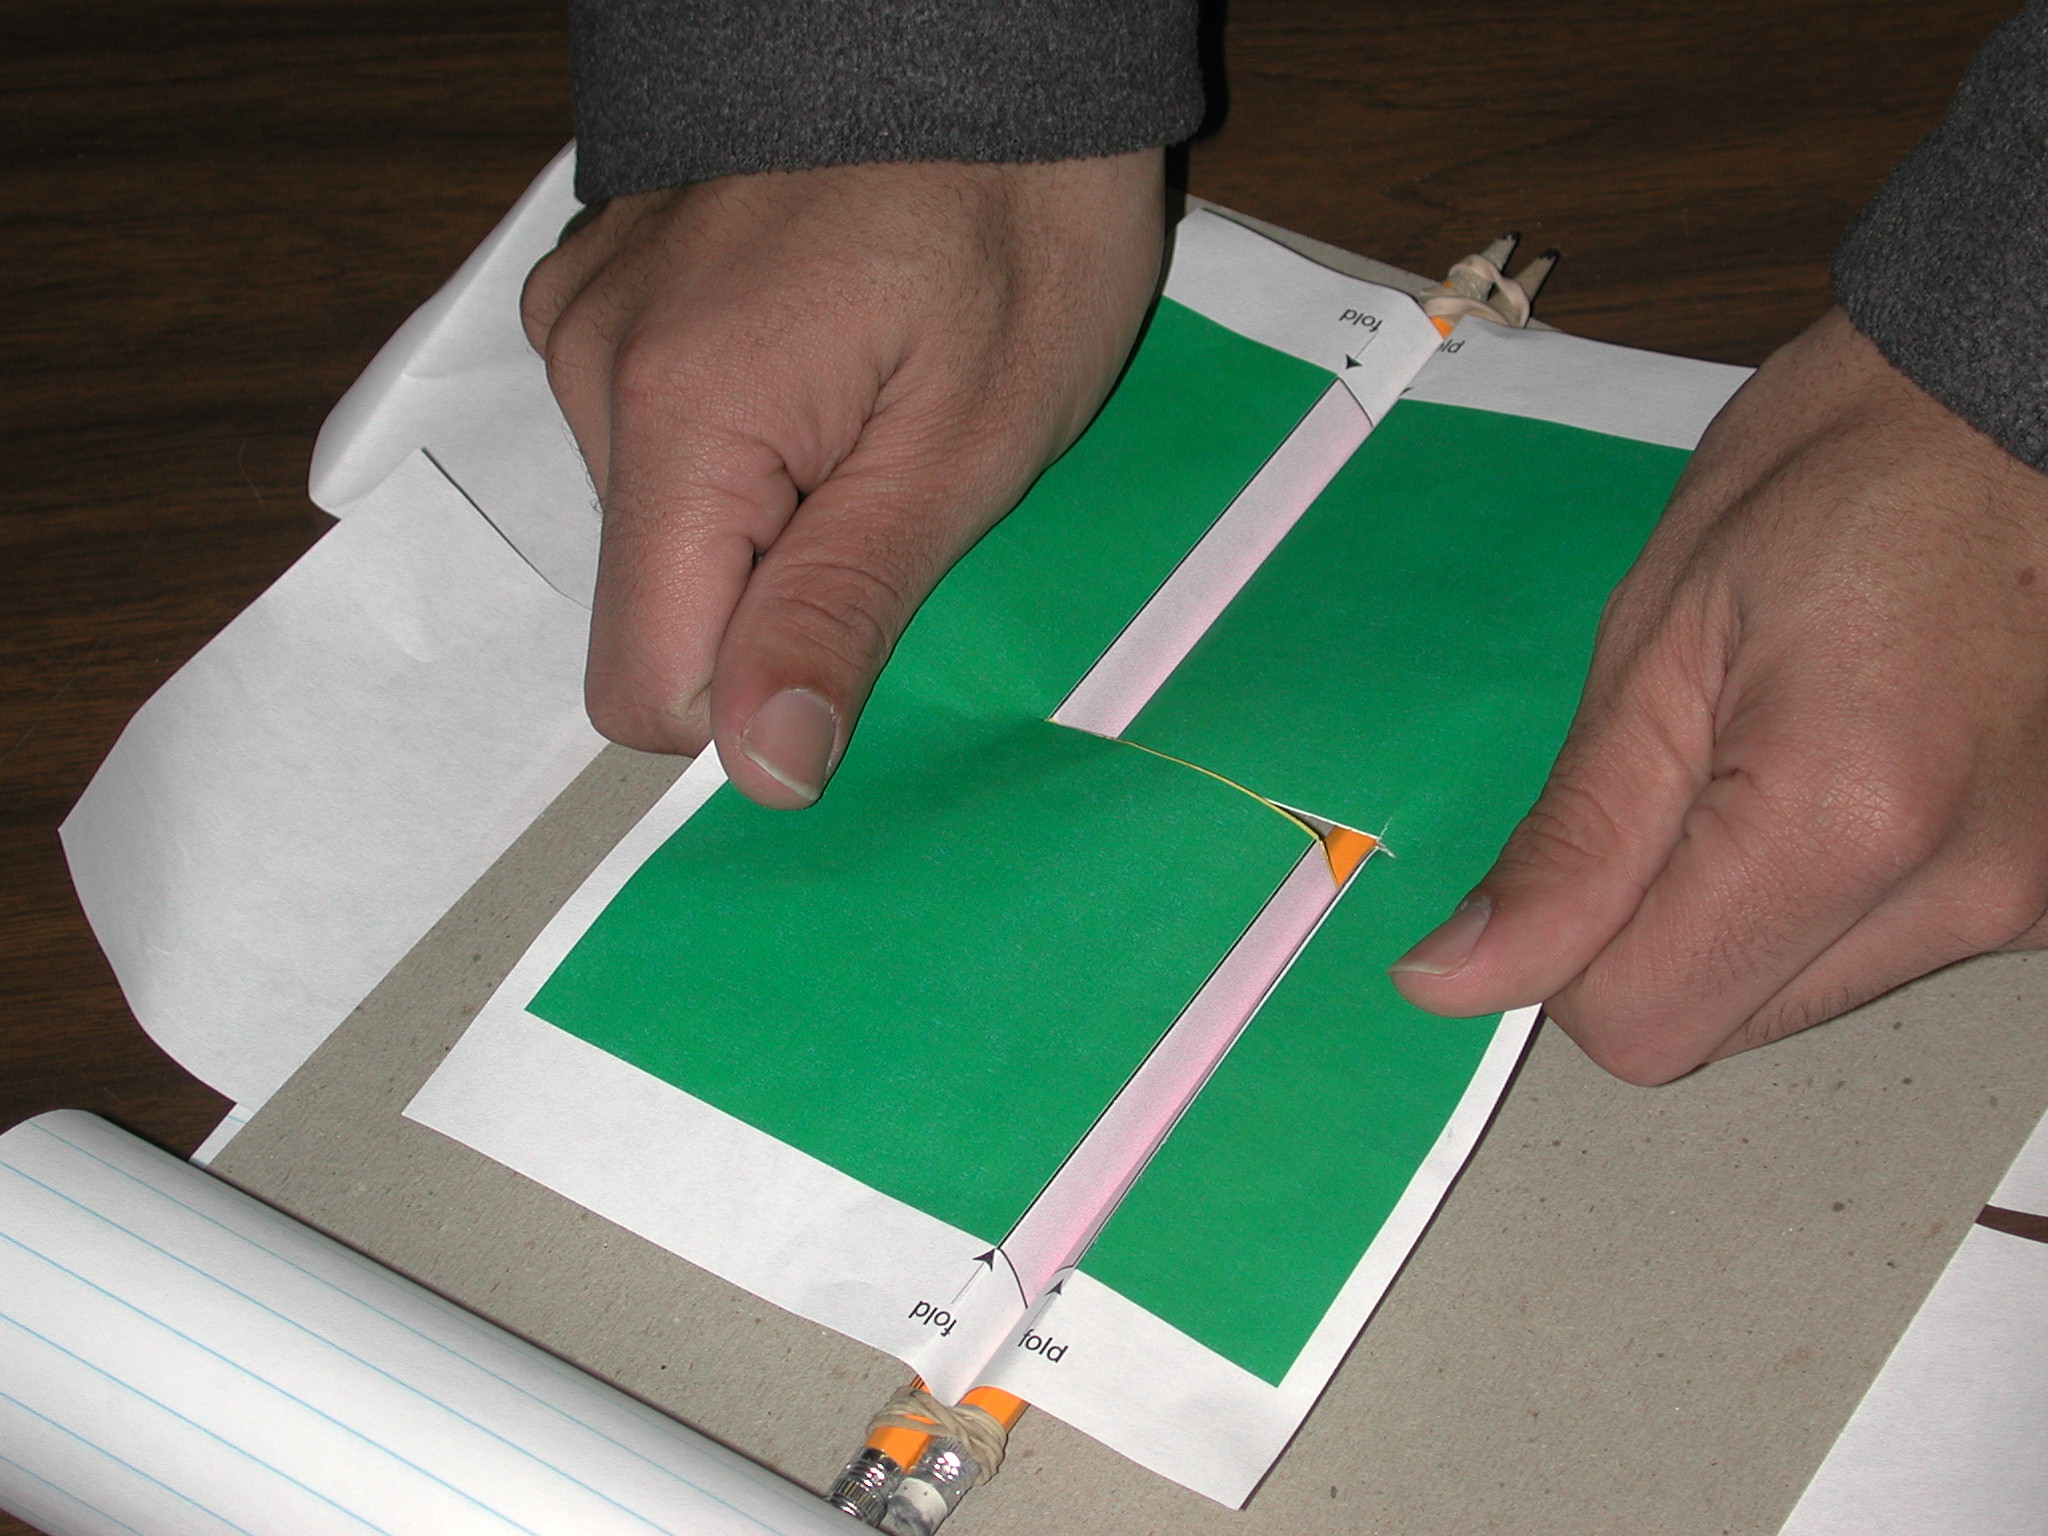
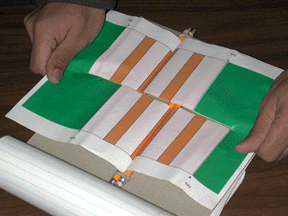
by teachers working with limited budgets. The model consists of two printed sheets of paper, four pencils held together with elastic bands and a piece of cardboard with slits. The paper “plates” are threaded through the pencils and the slits in the cardboard. The plates can be slowly pulled back through the pencils to illustrate plate motion. The design printed on the plates is meant to illustrate two continents breaking apart and changes in the polarity of the magnetic field with time.
Radioactivity with Pennies and Dice
|
|
I use this activity to illustrate the radioactive decay of atoms and the concept of half-life. These concepts are fairly abstract so I use this activity after discussing the concepts with the class. I give each pair of students a set of 10 gaming dice and 10 pennies. Each group of students will have a different type of gaming dice with 12, 10, 8, 6 or 4 sides. The students choose a side that represents a decay event and are asked to throw the dice/pennies and remove whichever individuals have landed with the chosen side up |
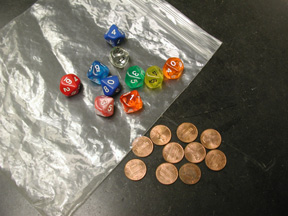
– these represent atoms that have decayed. This is repeated until all of the dice or pennies have “decayed” or until 15 throws have been made. After each throw, the students record the number of dice or pennies remaining. The students repeat the experiment 10 times and sum the data. This gives them a data set large enough to generate reasonable decay curves. The students then graph the number of items remaining versus the number of throws and use the graphs to determine a half lives for the pennies and dice. Data from student groups are compiled on an overhead so students can see the difference in the “decay curves” for dice with 12, 10, 8, 6 and 4 sides.
Tags: activities, burnley, examples, hands, 1192021
- TRAVELLER PROFILE FORM REFERENCE CONTACT AT COMMONWEALTH SECRETARIAT
- MODEL-Cerere-de-Restituire-Garantie-1
- KRITERIJI ZA SUDJELOVANJE U POZIVU ZA PRIKUPLJANJE PRIJEDLOGA PROGRAMA
- CONQUEST COPYRIGHT NOTICE CONQUEST IS COPYRIGHT © 1990
- CONCURSO LITERARIO 2003 ACTA EN MONTEVIDEO A LOS
- 35 EXPERIMENT IV CALORIMETRY SPECIFIC HEAT OF A METAL
- VIRHEET JA SELITYKSET ALLA ALLT KOSKA ALLA
- IN ORDER FOR A MONEY MARKET FUND TO PARTICIPATE
- Thema Namen wie Entstanden Nachnamen? bis Ungefähr ins
- COLINA A TREINTA DE JUNIO DE DOS MIL NUEVE
- BANCO CENTRAL DE BOLIVIA DOCUMENTO BASE DE
- TAAHHÜTNAME BAŞVURULARINDA DIKKAT EDILMESI GEREKEN HUSUSLAR KURUMUMUZA GÖNDERILEN YURTDIŞINA
- STATE COURTS AND ELDER ABUSE ENSURING JUSTICE FOR OLDER
- KOMENTÁŘ K NÁVRHU ROZPOČTU NA ROK 2010 KAPITOLA 05
- PROGRAMA DE DE LENGUA Y LITERATURA CURSO 3º 1ª
- CLASE 4 VIDEO PODER LA TV ESTA CAMBIANDO
- PASSPORT FOR NC AHEC HEALTH CAREERS STUDENTS PASSPORT FOR
- CNII%20Handout%203%20-%20Conjoint%20Needs%20Identification%20Interview%20form
- APPENDIX B APPROVED JD FORM APPROVED JURISDICTIONAL DETERMINATION FORM
- F COLOCAR EL LOGO DE LA CLÍNICA ICHA MÉDICA
- International Crewing Agents Head Office 311 Cesu str
- ENGLISH LOI DE 1992 SUR LES RECOURS COLLECTIFS RÈGLEMENT
- 4 YÜZÜNCÜ YIL ÜNİVERSİTESİ YABANCI DİLLER HAZIRLIK SINIFLARI EĞİTİMÖĞRETİM
- REPARTIDO Nº 4 PROGRAMACIÓN LINEAL 2º E M
- A LLEGATO REGISTRO CONSEGNA MATERIALI REGIONE CAMPANIA
- 1 EN UN VIVERO TIENEN 18 CAJAS DE 50
- IMPORTANCE OF HAIR COVERINGS HAIR RESTRAINT THE PLANT
- ACADEMIC AND GOVERNANCE SERVICES HONORARY VISITING AND COURTESY TITLES
- A USSCHREIBUNGSTEXT ZENTRALBATTERIELEUCHTE L5 RETTUNGSZEICHENSICHERHEITSLEUCHTE FÜR UNIVERSALMONTAGE (WANDDECKEKETTE) FLACHE
- GYULAI POLGÁRMESTERI HIVATAL IKTATÓSZÁM VI4852017 J E G
INSTRUCTIONS FOR AUTHORS IN ACCORDANCE WITH THE SCOPE OF
TITOLO “REALIZZAZIONE DI MODULI LINUX PER MISURE PRESTAZIONALI DELLE
ARBEIDSBESKRIVELSE FOR DIRIGENT (FOR MUSIKKORPS I NORGES MUSIKKORPS FORBUND)
 DRUŠTVO ZA ZDRAVJE IN IZOBRAŽEVANJE VITA PIVKA DRUŠTVO
CHAPTER 16 NOMENCLATURE AND BOTANICAL NAMES REVIEW QUESTIONS NOMENCLATURE
SZCZECIN WYNAJEM POWIERZCHNI REKLAMOWEJ W FORMIE BILLBOARDÓW ORAZ WIELKIEGO
 LIBROS DIARIO Y MAYOR 1 INTRODUCCIÓN 2 EL DIARIO
 18TH OCTOBEROTUBRU 2000 INFECTIOUS DISEASE SURVEILLANCE AND EPIDEMIC PREPAREDNESS
ADRENALINE (EPINEPHRINE) INJECTION 110000 PRESCRIBING INFORMATION PLEASE REFER TO
TEHLİKELİ ATIK İHRACATI BAŞVURULARINDA TALEP EDİLEN EVRAKLAR BAŞVURU DOSYA
 POWERPLUSWATERMARKOBJECT3 ————————————————————————————————————————————————————————————————————————————�
HIERMIT WIRD IN SACHEN WEGEN RECHTSANWÄLTIN KERSTIN KÜHN
 C ALAFATE CLÁSICO 4 DÍAS – 3 NOCHES DÍA
 ZAŁĄCZNIK 1A DEKLARACJA ABSOLWENTA PRZYSTĘPUJĄCEGO DO EGZAMINU MATURALNEGO PO
SALINAN LAMPIRAN VI PERATURAN BERSAMA MENTERI PENDIDIKAN DAN KEBUDAYAAN
 “…VELAR NO SIGNIFICA TENER LOS OJOS MATERIALMENTE ABIERTOS SINO
WSKAZÓWKOWE PRZYRZĄDY POMIAROWE ŚLUZĄ DO WSKAZYWANIA ZA POMOCĄ WSKAZÓWKI
 INFORME NRO DFOESM762008 5 DE DICIEMBRE 2008 DIVISIÓN DE
HISTORIC SITES REVIEW COMMITTEE (HSRC) APPLICATION THE HISTORIC SITES
MAJOR REPAIR FAQ’S WHAT ARE MAJOR REPAIRS THESE ARE
