CE361 INTRODUCTION TO TRANSPORTATION ENGINEERING POSTED FRI 26 SEPTEMBER
CE361 INTRODUCTION TO TRANSPORTATION ENGINEERING POSTED FRI 26 SEPTEMBERIPCCE3611 ANNEX III PAGE 3 IPCCE3611 ANNEX III AMENDMENTS
IPCCE3611 ANNEXE V PAGE 4 IPCCE3611 ANNEXE V PROCÉDURE
IPCCE3611 TECHNICAL ANNEXES PAGE 19 ANNEX 1 A 01
1
|
CE361 Introduction to Transportation Engineering |
Posted: Fri. 26 September 2008 |
|
Homework 4 |
Due: Mon. 6 October 2008 |
TRANSPORTATION PLANNING AND DEMAND MODELING
Dear Consultant:
To demonstrate your basic travel demand modeling capabilities, please complete the exercises below completely and clearly. You may work in a group of CE361 students not to exceed four in size. If the HW is submitted by more than one student, the signatures (and printed names) of those students must appear at the top of the front page of the materials submitted.
1. Site-based Trip Generation. The site of interest is the McDonald’s restaurant on the southeast corner of Northwestern and Stadium Avenues.
(5 pts) How large is the building on the site? How did you determine this?
(5 pts) How many seats are there at the site? How did you determine this?
(5 pts) Using the pages for Land Use 934 provided from the ITE Trip Generation report here, compute T, the expected vehicle trip ends during the AM peak hour of Adjacent Street Traffic. Show your calculations.
(5 pts) Which value of T would you adopt? Why?
HH-Based Regression for Trip Generation. The Mythaca Regional Planning Commission (MRPC) wants to try the following zonal equations:
P(i) = 53 + 6.1 HHs/zone + 4.5 vehs/zone + 3.4 jobs/zone
A(j) = 58 + 4.3 HHs/zone + 5.2 jobs/zone
A. (15 points) Using the socioeconomic data in Table 4.1 below, calculate the productions and attractions for each zone and present your results in a table with the format of FTE Table 4.6. If you use a spreadsheet to produce your results table, show one P and one A calculation done by hand.
|
Table 4.1 Middleville T/G data |
|
|
||||
|
TAZ |
pop |
HH |
vehs |
empl |
|
|
|
1 |
0 |
0 |
0 |
1000 |
|
TAZ = traffic analysis zone |
|
2 |
0 |
0 |
0 |
1500 |
|
pop = population in zone |
|
3 |
3000 |
1100 |
1400 |
0 |
|
HH = households in zone |
|
4 |
2000 |
900 |
1600 |
0 |
|
vehs = vehicles owned by HHs in zone |
|
Totals |
5000 |
2000 |
3000 |
2500 |
|
empl = employment = jobs in zone |
B. (5 points) Balance the P and A values for each zone as described at the start of FTE Section 4.3.3. Show the revised values in a new column in the table you created in Part A.
(20 points) Trip Distribution by Gravity Model. Regardless of your results in Problem 1, use A(1)=8500, A(2)=12000, A(3)=7500, and A(4)=6000 in this problem. Using the Tanner Function, the format of FTE Table 4.11, and the auto travel times in the upper left quadrant of Table 4.12, determine how many trips produced in Zone 3 will be attracted to each of the four zones if P(3) = 16,850. Use a = 1.0, b = 3.8, and c = -0.25 in the Tanner Function.
(20 points) Mode Choice. The MRPC paid a lot of money to a consulting firm last year to develop a mode choice model to explain how commuters choose between bus and driving alone. The consultants surveyed hundreds of commuters, asking them (a) what mode they chose and (b) what factors affected their choice of travel mode. The consultants claim that the only measurable factor that mattered to commuters was total travel time (TTT). The proposed utility function was Vm = a*TTTm. In one travel corridor, auto TTT = 33.6 minutes and bus TTT = 57.5 minutes. Despite the clear auto advantage in total travel time, 20 percent of the commuters in the corridor chose bus. The consultant said that other, unmeasurable factors caused some commuters to choose bus. The MRPC wants you to check the consulting firm’s calculations. What value of a (to the nearest 0.001) in the utility function will cause pbus = 0.20 and pauto = 0.80?
Trip Assignment. Saturday midday traffic flow is 5850 vph from Mythaca to Econoly. There are two “reasonable” routes from Mythaca to Econoly. The route using the limited access highway A has a free-flow travel time of 47 minutes, C(A) = 3260, a = 0.15, and b = 4.7. The standard highway route B has a free-flow travel time of 21 minutes, C(B) = 1440, a = 0.40, and b = 5.5. Consider the capacity values to be at LOS “C”.
(15 points) Equilibrium condition. Using Equation 4.13, determine the flows V(A) and V(B) -- to the nearest 5 vph -- that occur when the 5850 vph are assigned to routes A and B so that user equilibrium occurs.
(5 points) Equilibrium travel time. Show that the travel times on the two routes are equal.
Tags: ce361 introduction, of ce361, posted, transportation, september, introduction, ce361, engineering
- OSIJEK 7 PROSINCA 2018 OBRAZLOŽENJE FINANCIJSKOG PLANA ZA 2019
- ΔΕΛΤΙΟ ΔΙΑΓΩΝΙΣΜΩΝ ΟΙ ΣΎΝΔΕΣΜΟΙΕΠΙΜΕΛΗΤΉΡΙΑ ΠΑΡΑΛΉΠΤΕΣ ΤΟΥ ΠΑΡΌΝΤΟΣ ΔΕΛΤΊΟΥ ΠΑΡΑΚΑΛΟΎΝΤΑΙ
- H YBRIDVEHICLES INSULATION TESTING ON HYBRID CARS THE WORD
- 2018 CANADIAN MIXED DOUBLES CURLING TRIALS JANUARY 2 –
- INSULIN QUESTIONS ADN SKILLS LAB FIVE (5) QUESTIONS TO
- MAKING CONNECTIONS TOOLKIT INCLUDING YOUNG PEOPLE
- CURRICULUM VITAE SAMUEL PALERMO 8 SAMUEL PALERMO
- MAYO 2021 AUTORIZACIÓN DE POSTULACIÓN Y DE NÚCLEO FAMILIAR
- HERITABILITY AND GENETIC CAUSATION TOTAL WORD COUNT 4959 ABSTRACT
- SOFTWARE REQUIREMENTS SPECIFICATIONS OF XXX SOFTWARE DOC VERSION
- NHS SUSSEX CQUIN INDICATOR 201213 SAFETY THERMOMETER (A) SAFETY
- AVANCE INFORMATIVO 12 DE NOVIEMBRE DE 2004 REGIÓN MURCIA
- INSTRUCTIONS FOR AUTHORS ALIFEXV PROCEEDINGS FIRST AUTHOR1 SECOND AUTHOR2
- CE3 FORM CE3 CONTROL EQUIPMENT INFORMATION FOR WET OR
- LECCIÓN 2 ESTADÍSTICA DE ELECTRONES Y HUECOS EN LOS
- INTERNATIONAL FRAMEWORK FOR CHEMICALS MANAGEMENT KEY LESSONS FROM THE
- ØKONOMISTYRING – AAGE SENDING EXCEL PÅ NORSK OG PÅ
- FIGURAS DE LA BIBLIA (SIMBOLOS TIPOS Y FIGURES) PR623
- 15 MUSICAL ELEMENTS OF BILL EVANS PLAYING “ON A
- SENTERETS KOMPETANSE BOTRENINGSSENTERET HAR HATT ET MEGET STABILT PERSONALE
- ZAŁĄCZNIK NR 2 DO JN1441P100000 IDENTYFIKACJA ZGŁOSZENIA (WYPEŁNIA JEDNOSTKA
- SINDIKAT VZGOJE IZOBRAŽEVANJA ZNANOSTI IN KULTURE SLOVENIJE JE NA
- OBRAZAC 7 REPUBLIKA HRVATSKA MINISTARSTVO HRVATSKIH BRANITELJA IZVJEŠĆE
- EXPERIMENTAL INVESTIGATION AND MULTICOMPONENT MODELING OF URANIUM TRANSPORT IN
- 1512 REPORTING NOTICE REGARDING REQUIREMENTS FOR SUBRECIPIENT DUNSCCR REGISTRATION
- TRAMITACIÓN DE LIBRETA SANITARIAINSTRUCTIVO ¿EN QUÉ CONSISTE PARA QUÉ
- PREDLOG NA PODLAGI PETEGA ODSTAVKA 87 ČLENA STANOVANJSKEGA ZAKONA
- Ðïࡱáþÿ x8ax8cþÿÿÿx86x87x88¥áàð¿àobjbjöx9aöx9ap«´ð´ðäÿÿÿÿÿÿ·£££££ÿÿÿÿ····|3l·~¦x96x98x98x98x98x98x98ý&²x8f) x98x81£üx98££×øøøj££x96øx96øøvx80!dÿÿÿÿùx91döÿÿÿÿx88à! x820ì!xx99x88¸
- OFFICE OF RESEARCH OVERSIGHT RESEARCH AND DEVELOPMENT COMMITTEE CHECKLIST
- PREGUNTAS TIPO TEST TEMA 3 1 LA PALABRA HECHOS
 OBRAZAC 1 ERASMUS STUDENT APPLICATION FORM FOR THE ACADEMIC
 UNIDAD 3 31 ESTRUCTURA ACTUAL DE LA BALANZA DE
GUDSTJENESTER I SLAGEN MENIGHET TID KIRKE PREST ORGANIST
 THE WORLD BANK FINANCED CNJIANGXI POYANG LAKE BASIN AND
 TEMARIO DETALLADO DEL CURSO DE ESPECIALISTA UNIVERSITARIO EN APLICACIONES
 COORDINATE ALGEBRA UNIT 3 – LINEAR & EXPONENTIAL 32
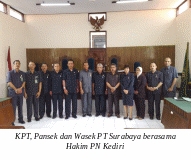 KUNJUNGAN KERJA KPT SURABAYA DALAM RANGKA PEMBINAAN KE 6
 DEPARTMENT OF THE CITY ELECTRICAL ENGINEER PLANNING DEVELOPMENT &
 ACUERDO DE LA COMISIÓN NOMBRADA POR EL PLENO DEL
FARMACIA SC SRL PROCEDURA DE RECEPŢIE A PRODUSELOR
 GRADE 7 MODULE 4A UNIT 2 LESSON 2 LOGIC
DECLARACIÓN RESPONSABLE DE LA RELACIÓN DEL PERSONAL CON CONTRATO
 RÉSUMÉ ROBERT L “BOB” ZAUNBRECHER PE EDUCATION BS
 5 WIERSZY WOLNYCH O WYSOKOŚCI 10 PKT KAŻDY I
 RN PDRP LEVEL INDICATORS FOR NURSING COUNCIL COMPETENCIES RELATING
 SIMRISHAMNS KOMMUN G RUPP 10 SAHAR AMINI JAKOB MATTSSON
OFERTAS DE EMPLEO DE LA PROVINCIA DE HUESCA FUENTE
7 REGULAMIN ORGANIZACYJNY BIURA ZWIĄZKU MIĘDZYGMINNEGO „CZYSTY REGION”
 SEGELL DE REGISTRE D’ENTRADA FULL D’INSCRIPCIÓ AL SERVEI D’ASSESSORAMENT
 APPLICATION TO CERTIFY LOSS AND EXPENSE RESERVES FOR CAPTIVE
