HTTPENWIKIPEDIAORGWIKIGINICOEFFICIENT JUMP TO NAVIGATION SEARCH THE GINI COEFFICIENT IS
HTTPENWIKIPEDIAORGWIKIGINICOEFFICIENT JUMP TO NAVIGATION SEARCH THE GINI COEFFICIENT IS
http://en
http://en.wikipedia.org/wiki/Gini_coefficient
Jump to: navigation, search
The Gini coefficient is a measure of inequality developed by the Italian statistician Corrado Gini and published in his 1912 paper "Variabilità e mutabilità". It is usually used to measure income inequality, but can be used to measure any form of uneven distribution. The Gini coefficient is a number between 0 and 1, where 0 corresponds with perfect equality (where everyone has the same income) and 1 corresponds with perfect inequality (where one person has all the income, and everyone else has zero income). The Gini index is the Gini coefficient expressed in percentage form, and is equal to the Gini coefficient multiplied by 100.
While the Gini coefficient is mostly used to measure income inequality, it can also be used to measure wealth inequality. This use requires that no one has a negative net wealth.
![]() [edit]
[edit]

Graphical representation of the Gini coefficient
The small sample variance properties of G are not known, and large sample approximations to the variance of G are poor. In order for G to be an unbiased estimate of the true population value, it should be multiplied by n/(n-1).
The Gini coefficient is calculated as a ratio of the areas on the Lorenz curve diagram. If the area between the line of perfect equality and Lorenz curve is A, and the area underneath the Lorenz curve is B, then the Gini coefficient is A/(A+B). This ratio is expressed as a percentage or as the numerical equivalent of that percentage, which is always a number between 0 and 1.
The Gini coefficient is often calculated with the more practical Brown Formula shown below:
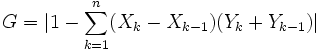
G: Gini
coefficient
Xk:
cumulated proportion of the population variable, for k = 0,...,n,
with X0
= 0, Xn
= 1
Yk:
cumulated proportion of the income variable, for k = 0,...,n, with Y0
= 0, Yn
= 1
[edit]
Gini coefficients in the world
See complete listing in list of countries by income equality.

![]()
Gini coefficient, by countries

![]()
While
most developed European nations tend to have Gini coefficients
between 0.24 and 0.36, the United States Gini coefficient is above
0.4, indicating that the United States has greater inequality. Using
the Gini can help quantify differences in welfare
and compensation
policies and philosophies. However it should be borne in mind that
the Gini coefficient can be misleading when used to make political
comparisons between large and small countries (see criticisms
section).
Note: The calculation of the index for the United States was changed in 1992, resulting in an upwards shift. Comparisons before and after that period may be misleading.

![]()
Gini coefficients over time for selected countries
[edit]
Development of Gini coefficients in the US over time
Gini coefficients for the United States at various times, according to the US Census Bureau:
[edit]
Advantages of the Gini coefficient as a measure of inequality
The Gini coefficient's main advantage is that it is a measure of inequality, not a measure of average income or some other variable which is unrepresentative of most of the population, such as gross domestic product.
Gini coefficients can be used to compare income distributions across different population sectors as well as countries, for example the Gini coefficient for urban areas differs from that of rural areas in many countries (though the United States' urban and rural Gini coefficients are nearly identical).
The Gini coefficient is sufficiently simple that it can be compared across countries and be easily interpreted. GDP statistics are often criticised as they do not represent changes for the whole population, the Gini coefficient demonstrates how income has changed for poor and rich. If the Gini coefficient is rising as well as GDP, poverty may not be improving for the vast majority of the population.
The Gini coefficient can be used to indicate how the distribution of income has changed within a country over a period of time, thus it is possible to see if inequality is increasing or decreasing.
The Gini coefficient satisfies four important principles:
Anonymity: it doesn’t matter who the high and low earners are.
Scale independence: the Gini coefficient does not consider the size of the economy, the way it is measured, or whether it is a rich or poor country on average.
Population independence: it does not matter how large the population of the country is.
Transfer principle: if income (less than the difference), is transferred from a rich person to a poor person the resulting distribution is more equal.
[edit]
Disadvantages of the Gini coefficient as a measure of inequality
The Gini coefficient measured for a large geographically diverse country will generally result in a much higher coefficient than each of its regions has individually. For this reason the scores calculated for individual countries within the E.U. are difficult to compare with the score of the entire U.S.
Comparing income distributions among countries may be difficult because benefits systems may differ. For example, some countries give benefits in the form of money while others use food stamps, which may not be counted as income in the Lorenz curve and therefore not taken into account in the Gini coefficient.
The measure will give different results when applied to individuals instead of households. When different populations are not measured with consistent definitions, comparison is not meaningful.
The Lorenz curve may understate the actual amount of inequality if richer households are able to use income more efficiently than lower income households. From another point of view, measured inequality may be the result of more or less efficient use of household incomes.
As for all statistics, there will be systematic and random errors in the data. The meaning of the Gini coefficient decreases as the data become less accurate. Also, countries may collect data differently, making it difficult to compare statistics between countries.
Economies with similar incomes and Gini coefficients can still have very different income distributions. This is because the Lorenz curves can have different shapes and yet still yield the same Gini coefficient. As an extreme example, an economy where half the households have no income, and the other half share income equally has a Gini coefficient of ½; but an economy with complete income equality, except for one wealthy household that has half the total income, also has a Gini coefficient of ½.
It is claimed that the Gini coefficient is more sensitive to the income of the middle classes than to that of the extremes.
Too often only the Gini coefficient is quoted without describing the proportions of the quantiles used for measurement. As with other inequality coefficients, the Gini coefficient is influenced by the granularity of the measurements. For example, five 20% quantiles (low granularity) will yield a lower Gini coefficient than twenty 5% quantiles (high granularity) taken from the same distribution.
As one result of this criticism, additionally to or in competition with the Gini coefficient entropy measures are frequently used (e.g. the Atkinson and Theil indices). These measures attempt to compare the distribution of resources by intelligent players in the market with a maximum entropy random distribution, which would occur if these players acted like non-intelligent particles in a closed system following the laws of statistical physics.
[edit]
Dixon, PM, Weiner J., Mitchell-Olds T, Woodley R. Boot-strapping the Gini coefficient of inequality. Ecology 1987;68:1548-1551.
Gini C. "Variabilità e mutabilità" (1912) Reprinted in Memorie di metodologica statistica (Ed. Pizetti E, Salvemini, T). Rome: Libreria Eredi Virgilio Veschi (1955).
[edit]
List of countries by income equality
List of countries by Human Development Index
[edit]
Measuring income inequality: a new database, with link to dataset
UN Human Development Report 2004, p50-53: Gini Index calculated for all countries.
[1] Comparison of Urban and Rural Areas' Gini Coefficients Within States
[2] World Income Inequality Database
[3], Forbes Article, In praise of inequality
Software:
Free Online Calculator computes the Gini Coefficient, plots the Lorenz curve, and computes many other measures of concentration for any dataset
Free Calculator: Online and downloadable scripts (Python and Lua) for Atkinson, Gini, Hoover and Kullback-Leibler inequalities
Users of the R data analysis software can install the "ineq" package which allows for computation of a variety of inequality indices including Gini, Atkinson, Theil.
Retrieved from "http://en.wikipedia.org/wiki/Gini_coefficient"
Categories: Welfare economics | Socioeconomics | Economic indicators
Views
Personal tools
![]() Navigation
Navigation
Search
![]()
![]()
![]()
Toolbox
In other languages
![]()
![]()
This page was last modified 08:22, 30 January 2006.
All text is
available under the terms of the GNU
Free Documentation License
(see Copyrights
for details).
Wikipedia® is a registered trademark of the
Wikimedia Foundation, Inc.
![]()
Tags: coefficient is, gini coefficient, httpenwikipediaorgwikiginicoefficient, navigation, coefficient, search
- TEMPLATE FOR APPRENTICESHIP PROGRAM STANDARDS [IE PROGRAM PLAN] THIS
- ALEGACIONES AL GRUPO ASIGNADO GRADO EN CC ACTIVIDAD FÍSICA
- AVISO MEDIANTE EL CUAL SE DA A CONOCER EL
- RAZVOJ ONTOLOGIJE UZ POMOĆ ONTOLOŠKOG EDITORA PROTEGEE ŠTO JE
- CAPÍTULO I ORIGINES DE JUANA NÚÑEZ 1 INTRODUCCION LOS
- ANNUAL REPORT UNDER MS4 GENERAL PERMIT NO WIS0500751 FORM
- PROGRAMA DE LANZAMIENTO Y DESARROLLO DE EMPRESAS 50K BASES
- SUTTON ELEMENTARY SCHOOL TITLE I PART A PARENTAL INVOLVEMENT
- JAMIE CASSELS UNDERGRADUATE RESEARCH AWARDS FOR THE UNIVERSITY OF
- ŘEDITEL SOKV ČESKÉ BUDĚJOVICE OSTRAVA ÚSTÍ NAD LABEM ŘEDITEL
- BASES DEL VIII CONCURSO DE “COCTELERIA TRAGO CORTO” ZAMORA
- ZA OBDOBÍ 2004 A V LEDNU A ÚNORU 2005
- TEMA VIABILIDAD DE MUSEOS EL ANÁLISIS DE LA VIABILIDAD
- SJR17 BECK TKEAN 0 §§12 C362249 & 362250
- COSTA RICA ES ESTE AÑO LA SEDE ORGANIZADO POR
- APPLICATION FOR AUDIT DAY REDUCTION FOR RULES 52 H)
- INTEGRACIÓN DE VARIABLES DEL TRANSPORTE EN EL DESARROLLO CONCURRENTE
- ASIGNATURA DERECHO INTERNACIONAL PRIVADO CÓDIGO 040131 I ASPECTOS
- EJEMPLO DE FACTURA FACTURA DATOS DE EMPRESA NÚMERO DOMICILIO
- BASES DEL VII CONCURSO DE PESCA DE TRUCHA A
- NATURAL SELECTION WORKSHEET NAME DATE PERIOD
- CONTRADICCIÓN DE TESIS 1582010 CONTRADICCIÓN DE TESIS 1582010 SUSCITADA
- UNIDAD CENTRAL DE CONTRATACIONES PROVINCIA DE ENTRE RIOS 1
- 0 (3) SE851 81 SUNDSVALL SWEDEN +46 771 670
- DARCY SCHWARTZ REISMAN PHD PT 4565 SIMON ROAD WILMINGTON
- HORÁRIOS DE AULA – EDUCAÇÃO INFANTIL – MANHÃ MINI
- BINAAN PEMUAT DAN PROSES CAS – NYAHCAS BAGI PEMUAT
- İŞ YERİ STAJ SÖZLEŞMESİ TC GİRESUN ÜNİVERSİTESİ …………… MESLEK
- 21REDNA SEJA OBČINSKEGA SVETA JUNIJ 2018 ZAPISNIK 10 KORESPONDENČNE
- LĪGUMS PAR BRĪVPRĀTĪGO DARBU RĪGĀ 20GADA JURIDISKA PERSONA
 2 INFORMATĪVAIS MATERIĀLS VALSTS SOCIĀLĀS APDROŠINĀŠANAS OBLIGĀTO IEMAKSU AVANSS
FICHA BIBLIOGRAFÍA COMENTADA ÁREA NECESIDADES EDUCATIVAS ESPECIALES TEMA ALTA
(IME I PREZIME) (ADRESA STANOVANJA) (TELEFONMOBITEL)
DETALLE DE LAS OFICINAS QUE PERMANECERÁN ABIERTAS DURANTE LAS
 BIOGRAM F CZYŻEWSKI BIBLIOGRAFIA CZŁONKÓW ŁÓDZKIEGO TOWARZYSTWA NAUKOWEGO CZYŻEWSKI
 DOCUMENTO DE CRÍTICAS DO ISIMP SERVER HISTÓRICO DE ALTERAÇÕES
MODELO ORIENTATIVO COMPROMISO DE COFINANCIACIÓN DEL 5 DE LAS
LUNES 30 DE DICIEMBRE DE 2002 DIARIO OFICIAL (TERCERA
HODNOCENÍ ŽÁKŮ – KLASIFIKAČNÍ ŘÁD VÝŇATEK ZE ŠKOLNÍHO ŘÁDU
 LATACUNGA DEDEL 202 ASUNTO CAMBIO DE TITULARIDAD SEÑORES EMPRESA
52 WALNY ZJAZD SIPWK KOMUNIKAT PREZYDIUM ZJAZDU DNIA 9
 JOB DESCRIPTION TITLE STUDENT DUTY MANAGER (SDM) DEPARTMENT MOOCH
HORIZONTAL POSITIONING OF THE TRUNK AND MAXIMAL LEG FLEXION
 P R P P UNIVERZITET U SARAJEVU UPRAVNI ODBOR
 FICHA DE INSCRIPCIÓN (POR FAVOR RELLENE TODOS LOS DATOS
 DIE TEILNEHMERGEBÜHR IST UNTER DER ANGABE „ZELTLAGER EBERSTEIN“
 PATVIRTINTA MARIJAMPOLĖS VAIKŲ LOPŠELIODARŽELIO „VAIVORYKŠTĖ” DIREKTORIAUS 2017 M RUGPJŪČIO
 RELACIÓN ENTRE EL TURISMO Y LOS CAMBIOS EN EL
 DOLNOŚLĄSKI ZWIĄZEK PIŁKI SIATKOWEJ WYDZIAŁ SIATKÓWKI PLAŻOWEJ 50529 WROCŁAW
KRALJEVICA 10 SVIBNJA 2012 GODINE BROJ 20052012 PREDMET
