LESSON PLAN FOR HIGH SCHOOL STUDENTS ON THE MILANKOVICH
CLASSROOM TESTED LESSON VIDEO DESCRIPTION “SECRETS OF THELESSON PLAN FORMAT FOR ELEMENTARY MIDDLE SCHOOL METHODS
SCIENCE LESSON PLAN IONIC AND COVALENT BODING
Teach Engineering Stem Curriculum Lesson Designing Bridges
UNIT SLAVERY LESSON 25 FREDERICK DOUGLASS (2
013_Spring1_UKS2_Yr5_Lesson_5
Lynn Terrien
Lesson plan for high school students on the Milankovich Cycles.
Time: 1 hour
Materials: computers & Internet access
Procedure:
1. Go to http://earthobservatory.nasa.gov/Library/Giants/Milankovitch/
and find out who Milutin Milankovitch was.
2. List 3 things Milankovitch studied:
a.
b.
c.
3. Define the following words so you have their meaning in front of you for the rest of this activity:
a. eccentricity –
b. obliquity –
c. precession –
4. Go to http://cimss.ssec.wisc.edu/climatechange/observations/lesson6/earthorbit.html.
H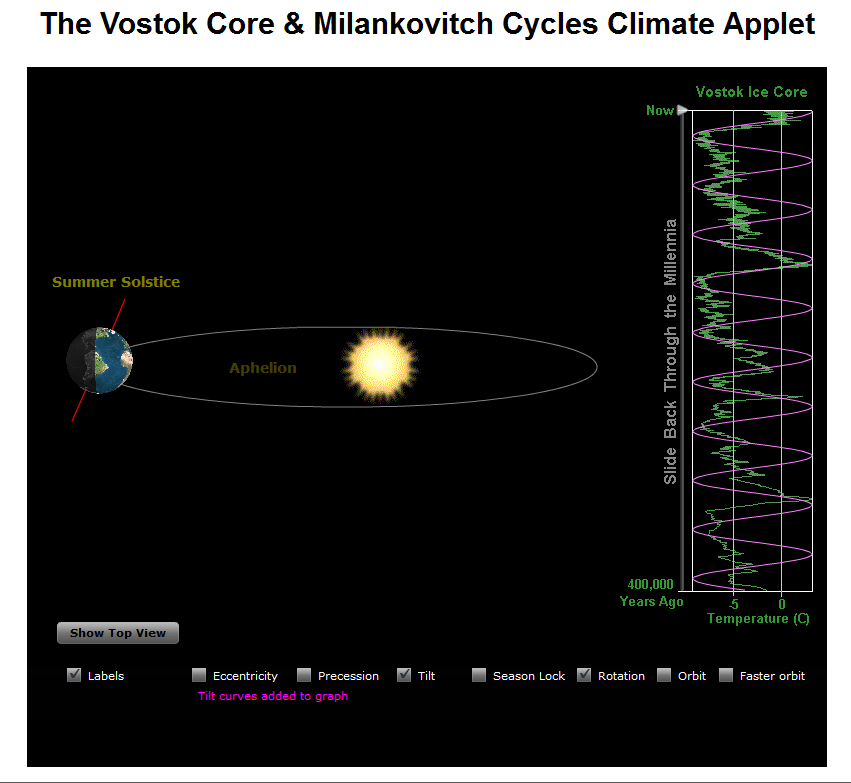 ere
you will find an activity featuring a rotating earth
ere
you will find an activity featuring a rotating earth
orbiting the sun and a graph of data from an ice core
documenting earth’s temperature over 400,000 years.
5. Click on the button “Show Top View”. You should now be able to view
the orbit of the earth from above. Circle the correct answer in the
parenthesis of each question.
The summer solstice is at the aphelion of the earth’s orbit.
Aphelion means the earth is (closer to, farther from) the sun.
The winter solstice is at the perihelion of the earth’s orbit.
Perihelion means the earth is (closer to, farther from) the sun.
6. Click on the button “Show Side View”. You should now be able to view the tilt of the earth on its axis as it rotates around the sun. Circle the correct answer in the parenthesis of each question.
a. The tilt of the earth’s axis is (toward the sun, away from the sun) during the
aphelion. (*Hint: Using the ‘Season Lock’ button may be useful. )
b. The tilt of the earth’s axis is (toward the sun, away from the sun) during the
perihelion.
7. Summarize how the tilt of the earth and it’s orbit determine the amount of solar radiation we receive here in _______, _______. (City, State)
8. The Vostok ice core was the result of a collaborative ice-drilling project between Russia and the U.S. in 1998. The core was drilled at the Russian station named Vostok in East Antarctica and produced the deepest ice core ever recovered. It reached a depth of 3,623 meters and the trapped air in the ice reveals changes in atmospheric composition of trace gases.
Milankovitch found that there are seasonal and latitudinal variations in the amount of solar radiation the earth receives. This can also be seen in the temperatures associated with the Vostok ice core on the graph to the right of the earth’s orbit. Circle the correct answer in the parenthesis of each question.
a. In the 400,000 years shown on the graph there are (2, 3, 4) distinct temperature cycles.
b. (True, False) Present day temperatures are the warmest we have ever experienced in the last 400,000 years.
Click on the ‘Eccentricity’ box on the bottom of the screen. This will produce a purple line on the Vostok ice core graph.
c. (True, False) The shape of the earth’s orbit correlates to the temperature of the earth.
Unclick the ‘Eccentricity’ box on the bottom of the screen. Click on the ‘Precession’
box on the bottom of the screen. This will produce a purple line on the Vostok ice
core graph.
d. The Precession line on the ice core graph shows (more, less) peaks and valleys than temperature.
Unclick the ‘Precession’ box on the bottom of the screen. Click on the ‘Tilt’ box on the bottom of the screen. This will produce a purple line on the Vostok ice core graph.
e. The tilt line on the ice core graph has (regular, irregular) peaks and valleys.
This would indicate that the tilt of the earth (does not change, changes).
Do not unclick the ‘Tilt’ box on the bottom of the screen. Now also click on the ‘Eccentricity’ and ‘Precession’ boxes so that all 3 factors contribute to the purple line on the Vostok ice core graph.
f. Of all of the purple lines that have been produced, this line that results from all 3 factors of eccentricity, precession and tilt is (most closely, less closely) related to temperatures in the last 400,000 years.
9. The Milankovitch Theory that cyclical variations in three elements of Earth-sun geometry combine to produce variations in the amount of solar energy that reaches Earth explains past climates. The Vostok ice core data corroborates this theory.
Recent studies show that the earth is warming up.
What are the connections (if any) between the Milankovitch Cycles and the current phenomenon of global warming?
1 EDTPA LESSON PLAN PROFESSIONAL GUIDELINES 72314 REVISED 8417
10 AMAZING LIFE LESSONS YOU CAN LEARN FROM ALBERT
10 MICRO I LESSON 3 PREFERENCES LESSON 2
Tags: lesson plan, lesson, students, school, milankovich
- TÜRKIYE’DE ENERJI VERIMLILIĞI PROJELERI IÇIN FINANSMAN KAYNAKLARI REHBERI TÜRKIYE’DE
- 3 NITROGENOUS WASTES AND WATER BALANCE AN
- PLANTAS Y HONGOS (NO INCLUYE FLOR) PROCESO CONSISTENTE EN
- JOB DESCRIPTION JOB TITLE VOLUNTEER COORDINATOR HOURS AS
- 21 VISION BASIC ANATOMY AND PHYSIOLOGY OF THE VISUAL
- PLATFORMA FLIPGRID – ABY UCZNIOWIE MIELI GŁOS – PROGRAM
- FACKET BROMSAR LÖNEUTVECKLINGEN AVTALSRÖRELSER BLIR OFTA ETT PROPAGANDANUMMER FÖR
- SANIDAD VEGETAL LEY 25794 MODIFÍCASE LA LEY N° 25614
- AUGLÝSING UM BÓKLEG EINKAFLUGMANNSPRÓF REYKJAVÍK 10 NÓVEMBER 2014 BÓKLEG
- LEMBAR KUISIONER PERGURUAN TINGGI PEDULI LINGKUNGAN DI SURABAYA INFORMASI
- MANUAL DE ACTUALIZACIÓN CTM700 ACCEDER A LA WEB HTTPWWWJMAESCTM700SERVER
- LABORATORIOS DE DISPOSITIVOS DE ALMACENAMIENTO Y DE ENTRADASALIDA MEMORIAS
- DESGLOSADO Nº 2 PROYECTO DE INFRAESTRUCTURAS ELÉCTRICAS NECESARIAS PARA
- MATERIAL SAFETY DATA SHEET 1 CHEMICAL IDENTITY CHEMICAL NAME
- 1 CAMBIO DE TITULARIDAD SEGÚN EL TIPO DE ACTIVIDAD
- WNIOSEK O SPORZĄDZENIE AKTU PEŁNOMOCNICTWA DO GŁOSOWANIA W WYBORACH
- ANEXO II (ENVIAR AL DPTO DE RELACIONES EXTERNAS) PETICIÓN
- EL CONFORT EN VEHÍCULOS FERROVIARIOS DE PASAJEROS GERMAN RENÉ
- REGIÓN DE MURCIA CONSEJERÍA DE MUJER IGUALDAD SERVICIO DE
- CUANDO SE REMITA A UN NIÑO AL MÉDICO TAMBIÉN
- PRESIDENCIA DEL CONSEJO DE MINISTROS (1º MAYO PUBLICADO EN
- UMOWA NR …………… Z DNIA …………… ROKU ZAWARTA POMIĘDZY
- STUDENT MENTOR PROJEKT STUDENTMENTOR PROJEKT STUDENTMENTOR 2008 GODINE POKRENULA
- © TIRANT LO BLANCH 2005 © REYES ARANDA LAFFARGA
- 12 PIELIKUMS LIEPU SENĀTA 19122016 SĒDES PROTOKOLAM NR5 NOLIKUMS
- ORGANISATION FOR ECONOMIC COOPERATION AND DEVELOPMENT PUBLICATION SPONSORED BY
- BUENOS VECINOS (NEIGHBORS) JULIO 2014 LIZ GIL LOS RECIENTES
- POWIATOWE CENTRUM POMOCY RODZINIE W STARGARDZIE TEL (091) 48
- FAX COVER SHEET TO [CLICK HERE AND TYPE
- ESTT OEP 2013 GRUPO DE MATERIAS COMUNES DE
 PLYMOUTH PAVILIONS POST TITLE EVENT TECHNICIAN DEPARTMENT
RAJIV GANDHI STATE INSTITUTE OF PANCHAYATI RAJ & COMMUNITY
 IDEAL GAS LAW EX9954 PAGE 7 OF 7 IDEAL
DATI ANAGRAFICI DELL’AZIENDA COGNOME O RAGIONE SOCIALE NOME SESSO
 REGISTER OF INTERESTS CHANGE HISTORY VERSION DATE OF APPROVAL
PROJEKT SIPVZ Č 0107P2006 S NÁZVEM „VZDĚLÁVÁNÍ RODIČŮ ŠKOLÁKŮ
CAPACIDAD DE ACTUAR E INTERACCIÓN MERCEDES LAGUNA GONZÁLEZ REVISTA
 EMNE INDBERETNING AF LEDIGE BOLIGER PR NR 629 1
ASSESSING AND GRADING STUDENT WRITING CAROLYN HAYNES DIRECTOR OF
ZAŁĄCZNIK NR 4 ZAKRES TREŚCI EGZAMINACYJNYCH DLA STUDENTÓW PRZYSTĘPUJĄCYCH
ANTRAG AUF MITGLIEDSCHAFT IM 1 BOULE UND PÉTANQUECLUB
 MINISTERIO DE EMPLEO Y SEGURIDAD SOCIAL PROCESO SELECTIVO DEL
INTERVIEWING? CREATE A GOOD IMPRESSION FIRST IMPRESSIONS MAKE A
 NEOS MARMARAS – LETO 2016 BUS + SMEŠTAJ +
 MAKALAH UNTUK MEMENUHI TUGAS PSIKOLOGI KEPRIBADIAN I TOKOHTOKOH YANG
 ANEXO COMENTARIOS DEL GOBIERNO DE CHILE A LAS OBSERVACIONES
REGULAMIN POBYTU NA PRAKTYKACH ZAGRANICZNYCH 1 W CZASIE
 A GE MONEY BANK TAGJA A BUDAPEST BANK NYRT
 CODE OF BEHAVIOUR INTRODUCTION THIS POLICY REPRESENTS THE COLLECTIVE
THIS PAPER WILL TELL YOU ABOUT THESE THINGS 1
