VIRTUAL FIELD TRIP INVESTIGATING THE EFFECT OF NITROGEN DEPOSITION
LOCATE AND OPEN THE LEARNING OBJECT VIRTUAL MICROSCOPEWWWCAPITALCALLINGCOM WWWVIRTUALLONDONCOM WWWWOODLANDSJUNIORKENTSCHUKCUSTOMSQUESTIONSINDEXHTML WWWLONDONTOWNCOM I
!DOCTYPE HTML HTML DIRLTR LANGESAR XMLLANGESAR HEAD TITLECAMPUS VIRTUAL
!DOCTYPE HTML HTML DIRLTR LANGESVE XMLLANGESVE HEAD TITLECAMPUS VIRTUAL
1 REAL IMAGE VIRTUAL IMAGE FORMED ON A SCREEN
21 SIMULATION AND VIRTUAL REALITY SIMULATION AND VIRTUAL REALITY

Virtual
Field Trip
Investigating
the effect of nitrogen deposition on heathland plant species
composition
TEACHER’S
NOTES AND ANSWER BOOKLET
About this Resource Pack
This pack was written by Dr Lauren Gough and Dr Amy Rogers (OPAL East Midlands, University of Nottingham). It is free to use for teaching purposes and additional electronic copies can be downloaded from www.OPALexplorenature.org/heathlandresources. This pack contains materials to support a field study in a heathland, one of our most endangered and fragile habitats. It is primarily aimed at students studying KS5 Biology or Environmental Studies.
The main aim of this resource is for students to understand the impacts of anthropogenic nitrogen pollution on heathland plant communities. The resource provides practical, scientific investigations without the need to organise a field trip. The resource is divided into three separate activities (see table below). You do not need to complete all three activities. The activities consider all aspects of scientific investigations from data collection techniques to statistical/graphical analyses. All activities utilise data from, or are based upon, genuine research that has taken place at the University of Nottingham.
|
Activity |
Aim |
Data collection, statistical and graphical skills covered |
|
Activity A |
Investigating the effect of nitrogen deposition on heather growth (dry mass) |
Spearman’s rank correlation coefficient Scatter plots Statistical significance |
|
Activity B |
Investigating the effect of nitrogen deposition on the percentage cover of bracken and heather in lowland heathlands. |
Collecting plant percentage cover data from quadrats Random and systematic sampling Bar graphs (clustered) Null hypotheses |
|
Activity B: Extension Activity |
Investigate whether nitrogen deposition affects the abundance of heather and bracken in heathlands. |
Mann Whitney U-Test Null/alternative hypotheses |
|
Activity C |
Investigating the effect of nitrogen deposition on heathland plant diversity and species composition. |
Simpson’s Index of Diversity (D) Null hypotheses |
A separate resource introducing students to heathland habitats is available from Open Air Laboratories (www.OPALexplorenature.org/heathlandresources). It is recommended that this resource (or aspects of this resource) is used to introduce the students to the heathland habitat before commencing the virtual field trip.
Resources Available
PowerPoint presentation – introduces students to nitrogen deposition and why it is a problem for heathlands, and leads students through each of the activities including: aims, objectives, data collection, analysis and evaluation. Tests and questions are included to provide interactive elements.
Quadrats (online version) – this PowerPoint document contains photographs of quadrats for students to calculate the percentage cover of bracken and heather on two different lowland heathland sites. Using this resource will require students be able access computers with the PowerPoint software (individual access or one computer between two).
Quadrats (print version) - Photos of quadrats can also be provided as printed sheets. A gridded quadrat template is also provided to assist students with making calculations. The template should be printed on OHP acetates and can then be overlain over the printed image of the quadrat. The template divides the quadrat into 100 evenly sized boxes to enable easier calculation of percentage cover. This template has been designed to be used with the print version of the quadrats (‘Quadrats.doc’).
Student workbook – gives students questions to work through, including statistical and graphical analysis.
Extension Activity – provides an extension to Activity B that uses Mann-Whitney U-tests to assess statistical significance. A separate answer booklet has been created for this activity.
Curriculum Links
|
OCR GCE Biology |
|
|
Unit F212: Biodiversity and Evolution (AS) |
Explain the importance of sampling in measuring the biodiversity of a habitat. |
|
|
|
|
Investigate the problems involved in collected data in the field. |
|
|
Unit F213: Practical Skills in Biology 1 (AS) |
Collection of quantitative data. |
|
|
Presentation, analysis and evaluation of quantitative data. |
|
|
|
|
Unit F215: Ecosystems and Sustainability (A2) |
Biotic and abiotic factors. |
|
Measure the effect of a changing abiotic factor on the distribution and/or abundance of an organism. |
|
|
Unit F216: Practical Skills in Biology 2 (A2) |
Collection of quantitative data. |
|
|
Presentation, analysis and evaluation of quantitative data. |
|
AQA GCE Biology |
|
|
Unit 2: The variety of Living Organisms (AS) |
Species diversity, index of diversity. |
|
Unit 3: Investigative and Practical Skills in AS Biology (AS) |
Investigating biological problems involves changing a specific factor and measuring changes in the dependent variable. |
|
Present, describe and interpret data. |
|
|
Identification of methodological limitations. |
|
|
Unit 4: Populations and Environment (A2) |
Populations and ecosystems. |
|
Investigating populations |
|
|
Nitrogen |
|
|
Unit 6: Investigative and Practical Skills in A2 Biology (A2) |
Investigating biological problems involves changing a specific factor and measuring changes in the dependent variable. |
|
Present, describe and interpret data. |
|
|
|
Identification of methodological limitations. |
|
|
Spearman’s Rank Correlation Coefficient |
|
Edexcel GCE Biology |
|
|
Unit 3: Practical Biology and Research Skills (AS) |
Produce and record reliable and valid results. |
|
Present and analyse data. |
|
|
Unit 4: The Natural Environmental and Species Survival (A2) |
Explain that the numbers and distribution of organisms in a habitat are controlled by biotic and abiotic factors. |
|
Describe how to carry out a study on the ecology of a habitat to produce valid and reliable data. |
|
|
Produce and record reliable and valid results. |
|
|
Unit 6: Practical Biology and Research Skills (A2) |
Present and analyse data. |
|
AQA GCE Environmental Studies |
|
|
Unit 1: Wildlife Conservation (AS) |
Habitat change. |
|
Introduction to UK habitats. |
|
|
|
Threatened habitats in the UK. |
|
Unit 1: Life Processes in the Biosphere (AS) |
Adaptation to the environment. |
|
Abiotic factors. |
|
|
Unit 1: Practical Skills (AS) |
Calculate Simpson’s Index of Diversity. |
|
Unit 3: Pollution (A2) |
Atmospheric pollution |
|
Mathematical requirements |
Spearman’s Rank Correlation Coefficient |
Background
What are lowland heathlands?
Lowland heathlands are open habitats, found less than 300m above sea level, and are usually dominated by heather and different species of grass. Shrubs, such as gorse, are frequently present in addition to scattered trees such as birch and oak. Bracken often becomes a pest species within heathlands. Lichens, fungi and mosses are common on the ground.
Heathlands are typically associated with sandy, acidic, low nutrient soils. Heathland sites may be large open areas or small fragmented patches within a woodland habitat. Heathlands are rare habitats and many are classified as Sites of Special Scientific Interest (SSSI). This means particular care must be taken to avoid damaging sites and you must have land owner permission to carry out any activities.
Figure 1: A typical lowland heathland
habitat
Where did they come from and where are they going!
Historically, many heathlands are the result of humans clearing the landscape for agriculture and timber. If left unmanaged, many would gradually undergo succession to form a forest. Many heathlands are managed carefully to maintain them as a heathland. Common management techniques include grazing or mowing to control the percentage cover of grass, rolling or chemically treating bracken to remove it, and tree removal.
What lives there?
Heathlands contain many species that are endangered or threatened. They are extremely important habitats for spiders and one of the only habitats in the UK that can contain all six of our native reptile species. Particular risks associated with heathlands in some areas include the possibility of encountering adders. A number of critically endangered birds are associated with heathlands, including nightjar. Some heathland birds are ground nesting and it would be best to avoid carrying out field trips to a site if birds are nesting there. Disturbance could result in them abandoning their nest.
What’s threatening this rare habitat?
Heathlands have declined rapidly over the last century. For example, Nottinghamshire is thought to have lost over 96% of its heathland during the last 250 years (Clifton and Keymer, 2009). Heathland is a priority habitat and many landowners are working actively to create more heathland habitats. Threats to heathlands include loss due to human activity (e.g. building housing estates), damage through inappropriate use (e.g. by dirt bike riders and rubbish tippers) and pollution.
Nitrogen pollution
The main form of pollution threatening heathlands is nitrogen pollution. Nitrogen pollution is pollution caused by nitrogen containing compounds. Nitrogen-pollutants include
Nitric Oxide (NO) and Nitrogen Dioxide (NO2) – collectively known as oxides of Nitrogen (NOX)
Ammonia (NH3)
Nitrogen pollution is a consequence of human activity e.g. NOX from burning fossil fuels, and NH3 from agricultural practices.
The amount of readily available nitrogen in the environment would naturally be a highly conserved cycle and normally nitrogen would be a limiting resource in different habitats. Over the last 300 years the amount of available nitrogen has shown huge increases due to an increase in fossil fuel burning and the development of the Haber-Bosch process to fix nitrogen in the air. The effect of nitrogen pollution on the environment is the subject of ongoing research. Nitrogen pollution is thought to have an effect on human health, reacting with haemoglobin in the blood, decreasing the function of the thyroid gland and causing Vitamin A deficiencies. Nitrous oxide is an important greenhouse gas and is thought to be contributing to climate change. The deposition of nitrogen into ecosystems can also affect the way that plants grow. To some plants it acts as a fertiliser and promotes growth. Other plants can become more sensitive to drought, frost and insect attack.
In heathland habitats, an increase in nitrogen is thought to promote the growth of fast growing species such as grass, bracken and bramble which then out-compete heathland specialists such as heather.
Good times to go
This field trip can be carried out at any time of the year. In the summer months more plants will be flowering, making it a more colourful experience. However, nightjar could be nesting from May- August so these months should be avoided if nightjar are present at your site.
References
Clifton, S.J. and Keymer, R.J. (2009). The Lowland Heathlands of the English East Midlands. Pp 48 – 62 Lowland Heaths: Ecology, History, Restoration and Management. Journal of Practical Ecology and Conservation Special Series, No. 5.
Answers to Activities
Activity A: The effect of nitrogen on heather growth (dry mass)
A1) Plot a scatter graph to show the effect of nitrogen deposition on the dry mass of heather.

A2) Complete columns 4 – 7 in Table 1.
|
Column 1 |
Column 2 |
Column 3 |
Column 4 |
Column 5 |
Column 6 |
Column 7 |
|
Site |
Nitrogen deposition (Kg N ha-1 year-1 (mean) |
Dry mass of heather (mg) (mean) |
Nitrogen deposition (rank) |
Dry mass of heather (rank) |
Difference between ranks (d) |
d2 |
|
site a |
2 |
4.3 |
26 |
18.5= |
7.5 |
56.25 |
|
site b |
2.4 |
1.0 |
25 |
26 |
-1 |
1 |
|
site c |
4.4 |
12.8 |
24 |
12 |
12 |
144 |
|
site d |
4.9 |
1.5 |
23 |
25 |
-2 |
4 |
|
site e |
5.5 |
5.1 |
22 |
17 |
5 |
25 |
|
site f |
5.8 |
3.0 |
21 |
23 |
-2 |
4 |
|
site g |
6.1 |
32.4 |
20 |
5 |
15 |
225 |
|
site h |
6.4 |
2.9 |
19 |
24 |
-5 |
25 |
|
site i |
6.7 |
3.6 |
18 |
22 |
-4 |
16 |
|
site j |
6.7 |
30.5 |
16.5= |
6 |
10.5 |
110.25 |
|
site k |
6.9 |
6.3 |
16.5= |
15 |
1.5 |
2.25 |
|
site l |
7.2 |
23.8 |
15 |
8 |
7 |
49 |
|
site m |
7.5 |
3.9 |
14 |
20.5= |
-6.5 |
42.25 |
|
site n |
8.1 |
18.7 |
13 |
10 |
3 |
9 |
|
site o |
8.4 |
39.9 |
12 |
3 |
9 |
81 |
|
site p |
8.8 |
29.2 |
11 |
7 |
4 |
16 |
|
site q |
9.1 |
12.4 |
9.5= |
13 |
-3.5 |
12.25 |
|
site r |
9.1 |
84.2 |
9.5= |
1 |
8.5 |
72.25 |
|
site s |
9.8 |
21.1 |
8 |
9 |
-1 |
1 |
|
site t |
9.9 |
5.4 |
6= |
16 |
-10 |
100 |
|
site u |
9.9 |
17.0 |
6= |
11 |
-5 |
25 |
|
site v |
9.9 |
4.3 |
6= |
18.5= |
-12.5 |
156.25 |
|
site w |
10.8 |
9.7 |
4 |
14 |
-10 |
100 |
|
site x |
11 |
40.0 |
3 |
2 |
1 |
1 |
|
site y |
11.4 |
39.2 |
2 |
4 |
-2 |
4 |
|
site z |
12.1 |
3.9 |
1 |
20.5= |
-19.5 |
380.25 |
A3) Use the formula shown below to calculate the Spearman’s Rank Correlation Coefficient (R) of the relationship between nitrogen deposition and heather dry mass. Write the Spearman’s Rank Correlation Coefficient (R) in the space provided below. Please show your working.
![]()
![]()
![]()
![]()
![]()
A4) Using the value of R obtained in question 2c) and the table shown below, state whether the relationship between nitrogen and the dry mass of heather is statistically significant at the 5% significance level.
|
|
Two-sided p |
||
|
n |
0.10 |
0.05 |
0.01 |
|
10 |
0.564 |
0.648 |
0
The critical value for a sample
size of 26, at the 5% significance level significance level is
0.392.
The value of the sample Spearman’s
Correlation Coefficient (R) is 0.431795. This is greater than
the critical value. Therefore, we can reject the null hypothesis
that there is no relationship between nitrogen deposition and the
dry mass of heather.
NB
– the critical value and the value of R are very close
together. It would be worth the researcher collecting more data
so that he could be certain that a significant relationship
exists.
|
|
11 |
0.536 |
0.618 |
0.818 |
|
12 |
0.497 |
0.591 |
0.780 |
|
13 |
0.475 |
0.566 |
0.745 |
|
14 |
0.457 |
0.545 |
0.716 |
|
15 |
0.441 |
0.525 |
0.689 |
|
16 |
0.425 |
0.507 |
0.666 |
|
17 |
0.412 |
0.490 |
0.645 |
|
18 |
0.399 |
0.476 |
0.625 |
|
19 |
0.388 |
0.462 |
0.608 |
|
20 |
0.377 |
0.450 |
0.591 |
|
21 |
0.368 |
0.438 |
0.576 |
|
22 |
0.359 |
0.428 |
0.562 |
|
23 |
0.351 |
0.418 |
0.549 |
|
24 |
0.343 |
0.409 |
0.537 |
|
25 |
0.336 |
0.400 |
0.526 |
|
26 |
0.329 |
0.392 |
0.515 |
|
27 |
0.323 |
0.385 |
0.505 |
|
28 |
0.317 |
0.377 |
0.496 |
|
29 |
0.311 |
0.370 |
0.487 |
|
30 |
0.305 |
0.364 |
0.478 |
A5) Using your results for questions A1 – A4 describe the relationship between nitrogen deposition and the dry mass of heather.
Answers may include the following:
There is a positive correlation between nitrogen deposition and the dry mass of heather.
As nitrogen deposition increases, the dry mass (and therefore growth rate) of heather increases.
A more detailed answer may recognise that although the relationship is positive it is not highly significant, indicating that factors other than nitrogen deposition are affecting heather growth rate/dry mass.
A6) Suggest reasons why the growth rate of heather under different nitrogen deposition regimes may differ when investigated under controlled laboratory conditions and when investigated in the field.
Answers may include, but are not limited to, the following:
The abiotic and biotic conditions that heather will experience differ greatly between controlled laboratory conditions and in the field.
In the field, heather may experience competition from other species which may affect its growth rate.
In the field, heather may suffer from grazing which would decrease its apparent growth rate.
In the field, heather may suffer from poor weather conditions which may affect its growth rate.
The abiotic (temperature, moisture) conditions applied in the laboratory may not have been optimum for heather.
In laboratory conditions, the supply of other soil nutrients can be controlled, whereas they cannot in the field. A presence/absence of other soil nutrients in the field will also have an effect on heather growth rates.
Activity B: Investigating whether nitrogen deposition affects the abundance of heather and bracken
Important points in relation to Activity B:
There are no ‘correct’ answers to questions B1 – B4. Percentage cover estimates will vary between students as it is a subjective measure - this could be demonstrated by asking students to compare the value they wrote down.
Students will only be able to record the percentage cover as they see it in the picture. In reality there may be layers of vegetation underneath the canopy layer (i.e., there may be heather underneath the bracken, but it cannot be seen on the photograph and therefore cannot be quantified). This is a limitation of this study. When vegetation surveys like this are conducted in the field all layers of vegetation would be considered and so percentage cover may exceed 100%.
There may be three species of heather present in the quadrat photos: ling heather (Calluna vulgaris), bell heather (Erica cinerea) and cross-leaved heath (Erica tetralix). In most cases it is not possible to distinguish between these three species on the photographs as it requires being able to see the shape or the flowers and the shape and arrangement of the leaves. Therefore, in this activity all three species are recorded together as ‘heather’.
The following answers are based on the percentage cover estimates shown in the table below.
B1) The quadrat photos can be provided to the students electronically (in the separate PowerPoint file) or on paper using the Word/PDF document provided. If the quadrat photos are provided as a paper resource (i.e., printed from ‘Quadrats.doc’), there is an accompanying grid (Quadrat template.ppt) which, if printed on OHP acetate, can be used to aid percentage cover measurements. The grid will divide the quadrat into 100 evenly sized boxes. Simple calculation of a plants percentage cover can then be made by counting the number of boxes in which the plant appears.
|
|
Site 1 – Low nitrogen deposition |
Site 2 – High nitrogen deposition |
||
|
Quadrat number |
Heather (% cover) |
Bracken (% cover) |
Heather (% cover) |
Bracken (% cover) |
|
1 |
65 |
0 |
0 |
45 |
|
2 |
40 |
0 |
45 |
45 |
|
3 |
65 |
0 |
35 |
50 |
|
4 |
50 |
40 |
10 |
60 |
|
5 |
60 |
0 |
0 |
90 |
|
6 |
50 |
0 |
0 |
70 |
|
7 |
50 |
15 |
0 |
50 |
|
8 |
65 |
35 |
10 |
55 |
|
9 |
75 |
10 |
10 |
50 |
|
10 |
35 |
25 |
0 |
40 |
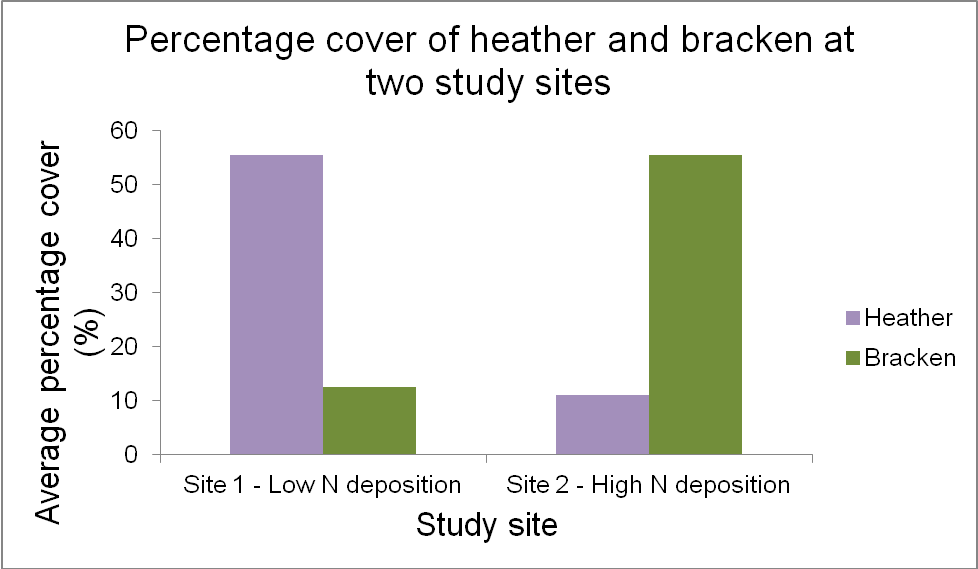
B2) Using the data collected in Table 3, calculate the mean percentage cover of bracken and heather for each of the two sites (Site 1 and Site 2).
|
Site 1 – Low nitrogen deposition
|
Site 2 – High nitrogen deposition
|
||
|
Heather 55.5%
|
Bracken 12.5%
|
Heather 11%
|
Bracken 55.5%
|
B3) Using the data generated in B2) plot a bar graph showing the mean percentage cover of heather and Bracken on each site using the graph paper below. Make sure you give your graph a title and clearly label both axes.
B4) Using the results of question B1 – B3, discuss whether the data you collected support or do not support the null hypothesis that:
H0 = Nitrogen deposition does not affect the abundance of heather and bracken.
The quadrat data show that the heather abundance is lower and bracken abundance is higher on the site with high nitrogen deposition (Site 2) than on the site with low nitrogen deposition (Site 1). The data do not seem to support the null hypothesis. However statistical analysis would be needed to confirm this conclusion. An extension activity has been provided in which students apply the Mann-Whitney U-Test to determine whether the difference in the percentage cover of heather and bracken between Site 1 and Site 2 is statistically significant.
Activity C: Investigating the effect of nitrogen deposition on the plant diversity and species composition of heathlands
|
C1) Use the data in Table 4 (see following page) to calculate the species diversity (D) of site 1 and site 2. Show your working.
Formula A Formula B
|
|
|
|
|
Where
N = total number of organisms of all species (i.e., total percentage cover)
n = total number of organisms (i.e., percentage cover) of a particular species
Σ = the sum of
Please use the formula that is required by your examination board.
NB – the data used for Activity C is percentage cover, not number of individuals as is usually used for the calculation of Simpson’s Index of Diversity (D). This is quite common in studies of plants where counting the number of individual plants can be difficult. The data can still be used to calculate the diversity index by using the percentage cover of each species for the value of n, and using the total percentage cover for the value of N. This may need to be discussed with students before completing this activity.
Formula A:
Site 1
|
Species |
n |
n(n-1) |
|
|
Calluna vulgaris |
80 |
6320 |
|
|
Betula pendula |
0 |
0 |
|
|
Ulex europaeus |
0 |
0 |
|
|
Pteridium aquilinum |
0 |
0 |
|
|
Vaccinium myrtillus |
4 |
12 |
|
|
Rubus fruticosus agg. |
0 |
0 |
|
|
Erica tetralix |
2 |
2 |
|
|
Deschampsia flexuosa |
4 |
12 |
|
|
Agrostis canina |
0 |
0 |
|
|
Holcus lanatus |
0 |
0 |
|
|
Hylocominum splendens |
6 |
30 |
|
|
Cladonia portentosa |
2 |
2 |
|
|
Cladonia uncialis |
2 |
2 |
|
|
N |
100 |
|
|
|
N(N-1) |
9900 |
|
|
|
Σn(n-1) |
|
6380 |
|
Site 2
|
Species |
n |
n(n-1) |
|
|
Calluna vulgaris |
20 |
380 |
|
|
Betula pendula |
2 |
2 |
|
|
Ulex europaeus |
2 |
2 |
|
|
Pteridium aquilinum |
18 |
306 |
|
|
Vaccinium myrtillus |
0 |
0 |
|
|
Rubus fruticosus agg. |
8 |
56 |
|
|
Erica tetralix |
0 |
0 |
|
|
Deschampsia flexuosa |
30 |
870 |
|
|
Agrostis canina |
10 |
90 |
|
|
Holcus lanatus |
4 |
12 |
|
|
Hylocominum splendens |
0 |
0 |
|
|
Cladonia portentosa |
0 |
0 |
|
|
Cladonia uncialis |
0 |
0 |
|
|
N |
94 |
|
|
|
N(N-1) |
8742 |
|
|
|
Σn(n-1) |
|
1718 |
|
Formula B
Site 1
|
Species |
n |
(n/N)^2 |
|
|
Calluna vulgaris |
80 |
0.64 |
|
|
Betula pendula |
0 |
0 |
|
|
Ulex europaeus |
0 |
0 |
|
|
Pteridium aquilinum |
0 |
0 |
|
|
Vaccinium myrtillus |
4 |
0.0016 |
|
|
Rubus fruticosus agg. |
0 |
0 |
|
|
Erica tetralix |
2 |
0.0004 |
|
|
Deschampsia flexuosa |
4 |
0.0016 |
|
|
Agrostis canina |
0 |
0 |
|
|
Holcus lanatus |
0 |
0 |
|
|
Hylocominum splendens |
6 |
0.0036 |
|
|
Cladonia portentosa |
2 |
0.0004 |
|
|
Cladonia uncialis |
2 |
0.0004 |
|
|
N |
100 |
|
|
|
Σ(n/N)^2 |
|
0.648 |
|
Site 2
|
Species |
n |
(n/N)^2 |
|
|
Calluna vulgaris |
20 |
0.045269 |
|
|
Betula pendula |
2 |
0.000453 |
|
|
Ulex europaeus |
2 |
0.000453 |
|
|
Pteridium aquilinum |
18 |
0.036668 |
|
|
Vaccinium myrtillus |
0 |
0 |
|
|
Rubus fruticosus agg. |
8 |
0.007243 |
|
|
Erica tetralix |
0 |
0 |
|
|
Deschampsia flexuosa |
30 |
0.101856 |
|
|
Agrostis canina |
10 |
0.011317 |
|
|
Holcus lanatus |
4 |
0.001811 |
|
|
Hylocominum splendens |
0 |
0 |
|
|
Cladonia portentosa |
0 |
0 |
|
|
Cladonia uncialis |
0 |
0 |
|
|
N |
94 |
|
|
|
Σ(n/N)^2 |
|
0.20507 |
|
C2) Compare the plant species composition of Site 1 and Site 2, making sure you discuss the following:
The abundance of heather species, bracken and trees
The abundance of species within different “species groups”
Answer may include the following (note that the data shown are for one quadrat at Site 1 and one quadrat at site 2):
Abundance of both heather species (Calluna vulgaris and Erica tetralix) is greater on Site 1 which has lower nitrogen deposition.
Bracken is absent from Site 1 (low N) but accounts for 18% of the vegetation cover in the quadrat on Site 2 (high N).
The quadrat on Site 2 (high N) contains trees (saplings) whereas the quadrat on Site 1 does not.
Site 2 (high N) has a greater abundance of grass species
Site 1 (low N) has a greater abundance of moss and lichen species, Site 2 (high N) has no lichen species.
C3) Using the results to questions C1 – C2, discuss whether the data you collected support or do not support the null hypothesis that:
H0 = Nitrogen deposition does not affect the diversity and species composition of lowland heathland vegetation.
The quadrat data indicate notable differences in the diversity (see answer to 5a) and species composition (see answer to C2) of the vegetation at the site with high nitrogen deposition (Site 2) and the site with low nitrogen deposition (Site 1). The data suggest that the null hypothesis cannot be accepted – nitrogen deposition appears to affect the diversity and species composition of lowland heathland vegetation. However, in order to confirm this more quadrats of vegetation would need to be collected and statistical analyses performed.


3 NEĮGALIŲJŲ REIKALŲ TARYBOS VIRTUALAUS POSĖDŽIO PROTOKOLAS 2020 M
46 VIRTUAL ORGANIZATION AND ELECTRONIC COMMERCE DRAFT NOVEMBER 2002
5ª REUNIÓN DE COORDINACIÓN DEL CAMPUS VIRTUAL DE SALUD
Tags: deposition on, nitrogen deposition, investigating, virtual, field, effect, nitrogen, deposition
- FITXA D’ESTUDIANT I COMUNICACIÓ SELECCIÓ EN PRÀCTIQUES FORMATIVES FICHA
- RISK MANAGEMENT – CORPORATE POLICY PURPOSE THE
- SECTION 10 4400 FIRE PROTECTION SPECIALTIES LANL MASTER
- ZAŁĄCZNIK NR 4A (PIECZĘĆ WYKONAWCY) SZCZEGÓŁOWY OPIS PRZEDMIOTU ZAMÓWIENIA
- {RTF1ANSIANSICPG0{FONTTBL{F0FROMANFCHARSET0 TIMES NEW ROMAN}{F1FSWISSFCHARSET0 TAHOMA}{F2FSWISSFCHARSET0 TAHOMA}{F3FSWISSFCHARSET0 ARIAL}{F4FSWISSFCHARSET0 ARIALBOLDITALICMT}{F5FSWISSFCHARSET0 ARIAL}{F6FROMANFCHARSET0
- UCHWAŁA NR XXVI2182021 RADY POWIATU W CHEŁMIE
- LABORATUAR ÇALIŞMASI 3 KONU VERI ARAÇGEREÇMALZEME BILGISAYAR ZAR MADENÎ
- MINISTERIO DE GANADERÍA AGRICULTURA Y PESCA DECRETO 210012 EXTIÉNDESE
- SELECT BIPARTISAN COMMITTEE TO INVESTIGATE THE PREPARATION FOR AND
- ……………………………………… KRAKÓW DNIA ………… ROKU IMIĘ I NAZWISKO ………………………………………
- DESCRIPTION OF PREPOSITIONS IN LIGHT OF THESE DESCRIPTIONS AT
- L FORMULARIO SOLICITUD LICENCIA FEDERATIVA FEDERAZIOAREN LIZENTZIA ESKATZEKO FORMULARIOA
- FORM 16C COURTS OF JUSTICE ACT CERTIFICATE OF SERVICE
- ACTA Nº 544 EN LA CIUDAD DE LA PLATA
- XXI ENCUENTRO MUJERES Y TEOLOGÍA 2016 EL IMPACTO DE
- NOTICE OF PRIVACY PRACTICES THIS NOTICE DESCRIBES HOW MEDICAL
- GAÑÁN DE MOLINA CECILIA 2016 DIFUSIÓN DE CONTENIDOS
- NZQA UNIT STANDARD 28025 VERSION 2 PAGE 2 OF
- PROPOZYCJA PRZEDMIOTU FAKULTATYWNEGO 20162017 PROWADZĄCY DR MIROSŁAW RADOŁA TYTUŁ
- UN DECRETO TROPPO EVASIVO DI SILVIA GIANNINI E MARIA
- LINEARITY COPYRIGHT Ó 1999 BY ENGINEERED SOFTWARE INC LINEARITY
- PRILOG 1 PRISTUPNICA ZA KORIŠTENJE USLUGE PRTNERNET ZA INTERNET
- DILIGENCIA DE COORDINACIÓN DEL PROYECTO PARCIAL O DOCUMENTACIÓN TÉCNICA
- COMENTARIO DE TEXTO ( 5) TEXTO 1 LUCES DE
- CHAPTER 6 SCALES AND INDEXES EXAMPLES SCALES AND INDEXES
- LEY 82005 DE 8 DE JUNIO DE PROTECCIÓN GESTIÓN
- RUNNING EFFECTIVE MEETINGS OBTAINED FROM HTTPWWWMINDTOOLSCOMCOMMSKLLRUNNINGMEETINGSHTM THERE
- MELDING VAN TECHNISCHE PROBLEMEN BIJ DE MASSAMETING VAN EEN
- 8 WEJŚCIE NA MIELIZNĘ MV ABIS BRESKENS (BHOLENDERSKIEJ) W
- DODATEK Č 2 KE SMLOUVĚ O ODVOZU VYUŽITÍ ČI
MANEJODEARCHIVOCPP PERMITE CREAR UNA ESTRUCTURA DE
 AWARD NOMINATION FORM MARCH 2017 AMCHP AWARD CELEBRATION
  PERSONAL PROTECT POLICY – INDIVIDUAL ACCIDENT INSURANCE PREAMBLE ICICI
ANNUAL REPORT REVIEW CHECKLIST (REGULATION 33) COMPANY LICENCE
 12 INTERNATIONAL SECURITIES SERVICES ASSOCIATION ISSA FINANCIAL CRIME COMPLIANCE
REQUEST FOR MODIFICATION APPROVAL FORM A PREREVIEW PROCESS
FLARES AND VAPOR COMBUSTORS FLARES (F) VAPOR COMBUSTORS
 Á REA DE DIDÁCTICA DE LAS CIENCIAS SOCIALES FACULTAD
LISTA MŁODYCH SPORTOWCÓW KTÓRZY OTRZYMALI WYRÓŻNIENIA WÓJTA GMINY GORLICE
 COURSE TITLE COURSE NUMBER ~ CREDITS ~ SEMESTER
LETTER OF AGENCY TO VERIZON AND ALL OTHER CONCERNED
ZAŁĄCZNIK 4B DO REGULAMINU ŚWIADCZEŃ DLA STUDENTÓW UNIWERSYTETU EKONOMICZNEGO
 POWERPLUSWATERMARKOBJECT3 INTERNAL CONTROL FRAMEWORK THE INTERNAL CONTROL FRAMEWORK
CAREER SEARCH SCAVENGER HUNT (WITH THE INTERNET) 1 THE
ATTACHMENT 1 CHANGE ORDER 2 VENDOR CONTRACT 0000000911 5120044302005
 XXII CERTAMEN LITERARIO INFANTIL Y JUVENIL ANTONIO MACHADO EL
ZAŁĄCZNIK NR 5 DO REGULAMINU STUDENCKICH PRAKTYK ZAWODOWYCH W
 KTÜ TIP FAKÜLTESİ BİLİMSEL ARAŞTIRMALAR ETİK KURULU ÖZGEÇMİŞ FORMU
6 RED LATINOAMERICANA PARA LA TRANSFORMACIÓN DE LA FORMACIÓN
AMEND SECTION 304 AGGREGATE BASE COURSE TO READ
