THE HERTZSPRUNG RUSSELL DIAGRAM THE HERTZSPRUNGRUSSELL DIAGRAM
THE HERTZSPRUNG RUSSELL DIAGRAM THE HERTZSPRUNGRUSSELL DIAGRAM
The Hersprung Russell Diagram
The Hertzsprung - Russell Diagram
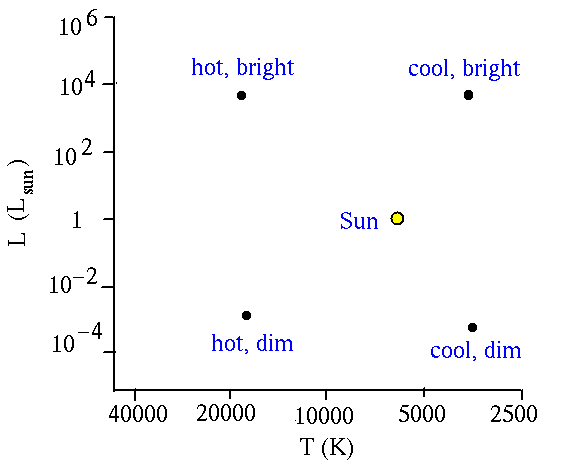
The Hertzsprung-Russell diagram is an analytical tool for understanding the properties of stars.
This diagram is a plot of stellar brightness (luminosity) versus stellar color (temperature).
Brightness (luminosity) is plotted along the Y-axis; color (temperature) along the X-axis.
The diagram is named for the two astronomers who created the first version around 1912, uncovering fundamental relationships between the properties of stars.
The observational HR diagram plots the brightness and colors of stars in units of magnitudes. This version of the HR diagram is also frequently termed the color-magnitude diagram.
The theoretical HR diagram plots the luminosity of stars expressed in solar units, against stellar surface temperature, expressed using the Kelvin temperature scale.
The X-axis is also labeled with the stellar spectral classifications.
Spectral class is defined by the type, number and strength of spectral lines observed in a star’s optical spectrum.
Spectral classes are coded by letter: O, B, A, F, G, K, M.
Spectral class and color are defined by the star’s temperature.
An HR diagram, plotted using luminosity on the Y-axis and temperature on the X-axis.
Stars, Revealed
What does the HR diagram reveal about the nature of stars ?
Stars do not smoothly populate the HR diagram, nor are they randomly distributed.
The HR diagram contains many “regions”, where stars are more concentrated:
Main sequence: A thin band extending from the top left of the diagram to the lower right. Dwarfs stars lie along the main sequence.
Red giant region: Located towards the upper right of the diagram. Stars located here are about 10 times larger than the Sun, and many time more luminous.
Supergiants: A band extending across the top of the HR diagram from blue to red. These are extremely large and luminous stars.
White dwarfs: A region in the lower left of the diagram. These are faint, hot, very small stars.
90% of stars lie along the main sequence, a consequence of the luminosity-radius-temperature relationship.
The Sun is classed as a G2 dwarf, and is located on the main sequence.
Stars range in temperature from the hot O stars (up to 50,000 K) to the relatively cool M stars (~3000 K).
Stars range in luminosity from 10-4 to 104 L.
Stars range in size from up to 500 R, labeled supergiants, to 0.01 R, the smallest M dwarfs.
The mass of a star defines its initial location on the HR diagram.
As stars evolve, their luminosity and temperature change — they “move” around the HR diagram.
Tags: diagram *, hr diagram, diagram, hertzsprung, russell, hertzsprungrussell
- NA PODLAGI 14 ČLENA STATUTA RIBIŠKE DRUŽINE MOZIRJE JE
- CONFÉRENCE INTERNATIONALE « LEUR DETTE NOTRE DÉMOCRATIE » PARIS
- PRACTICE QUESTIONS FOR GENERAL INTERVIEWS PERSONAL QUALITIES PLEASE
- REGULAMENT DE AVIZARE RECEPȚIE ȘI ÎNSCRIERE ÎN EVIDENȚELE DE
- DECLARACIÓN RESPONSABLE SOBRE LAS CIRCUNSTANCIAS Y NORMATIVAS URBANÍSTICAS DE
- CLOWN (INTERMEDIO) DEL 13 DE JUNIO AL 18 DE
- EQUILIBRIUM THERAPEUTIC RIDING BIRTHDAY PARTY APPLICATION FORM BASIC REGISTRATION
- PART II REVIEW ALGEBRA 2 UNIT 22 NAME PERIOD
- GIVEWELLS NOTES FROM CONVERSATION WITH WILLY FOOTE OF ROOT
- CENTRO INTERAMERICANO DE ADMINISTRADORES TRIBUTARIOSCIAT EVALUACION DE LA CAPACIDAD
- HIGH LIFE HIGHLAND JOB DESCRIPTION JOB TITLE CURATOR (DECORATIVE
- NZQA UNIT STANDARD 30949 VERSION 1 PAGE 4 OF
- I NSPECTORATUL ȘCOLAR JUDEȚEAN ILFOV NR 48 DIN 06012015
- PRIJAVNICA ŠTUDIJSKI PROGRAM ZA IZPOPOLNJEVANJE IZOBRAZBE IZ ZGODNJEGA UČENJA
- ANEXO V HOJA DE AUTOBAREMACIÓN DE LOS MÉRITOS ACADÉMICOS
- TOP OF FORM BACK TO MESSAGES (ARG) PSICÓLOGA SANCIONADA
- CONSEJERÍA YO DIRECCIÓN GENERAL PROPONENTE UNIDAD ADMINISTRATIVA SERVICIO PÚBLICO
- UNIVERSITY HOSPITALS BRISTOL NHS FOUNDATION TRUST TREASURY MANAGEMENT POLICY
- PODĽA POVAHY ZLOŽENIA A VZÁJOMNÝMI VZŤAHMI MEDZI NŠO
- TRANS200412 PAGE 7 UNITED NATIONS E ECONOMIC AND SOCIAL
- TMMOB HARITA VE KADASTRO MÜHENDISLERI ODASI 14 TÜRKIYE HARITA
- (IME I PREZIME) (ADRESA STANOVANJA) (TELEFONMOBITEL)
- STANISLAVSKIJ SONO PASSATI CENTO ANNI DA QUANDO KONSTANTIN S
- MEASUREMENT AND UNCERTAINTY NAME MEASURING THE DENSITY OF PENNIES
- ENCOUNTER FM COMMUNITY BROADCASTERS ASSOCIATION INCORPORATED CONSTITUTION AMENDED 16TH
- REVISED 22820 INSTRUCTIONS AND PROCEDURES FOR NEW CAPSTONE EXPERIENCE
- ACCORDO TRA LA REGIONE PIEMONTE E LE PROVINCE PIEMONTESI
- JOB DESCRIPTION TITLE CHIEF EXECUTIVE OF THE ROYAL CALEDONIAN
- T HE PIZZA GAME GOALS TO COUNT WITH UNDERSTANDING
- Č ESKÉ POVSTÁNÍ PROTI HABSBURKŮM PO SMRTI RUDOLFA II
USE 5 VERIFICATION OF DCC PY34 & PR104 RMM
 A VOWEL COMBINATION IS A COMBINATION OF TWO OR
DOKUMENT HANDLOWY STOSOWANY PRZY PRZEWOZIE WYŁĄCZNIE NA TERYTORIUM RZECZYPOSPOLITEJ
 TRATAMIENTO EJERCICIOS DE MUSCULACIÓN EJERCICIOS DE MUSCULACIÓN Y
ΠΙΝΑΚΑΣ ΦΥΤΟΠΡΟΣΤΑΤΕΥΤΙΚΩΝ ΠΡΟΪΟΝΤΩΝ ΚΑΙ ΒΙΟΚΤΟΝΩΝ ΠΟΥ ΕΓΚΡΙΘΗΚΑΝ ΤΟ ΕΤΟΣ
5 PRINCIPER OCH REGLER VID START OCH AVVECKLING AV
EJEMPLO EXÁMENES SANTO TOMÁS UNIENDO LAS PREGUNTAS 2 Y
 PROCEEDINGS OF WATER HYACINTH WORKSHOP INTERNAL REPORT 5 JUNE
ACADÉMIE TOULOUSE SERVICES DE L’ÉDUCATION NATIONALE GERS
 UNIP_TRG_obrsamoprev_M6_ubstdi
 AUDITORÍA Y CONSULTORÍA TEMAS 10 11 Y 12 (ITIL)
 APPENDIX 2 NONFREIGHT SURVEY TRANSPORT SCOTLAND & LEEDS UNIVERSITY
 JÓZEF DĄBROWSKI (ŁÓDŹ JULY 2008) PAPER MANUFACTURE IN CENTRAL
 A USSISA EDUCATION FOR SUSTAINABILITY RUBRICS AND CORE INDICATORS
FOUNDATION FOR SOCIETY AND LEGAL STUDIES (TOHAV) TORTURE REHABILITATION
PRACTICE FINAL EXAM (ANSWERS PROVIDED AT PRACTICE TEST’S END)
EVALUACIÓN UNIDAD 9 NOMBRE APELLIDOS FECHA
 STATUTORY KEY STAGE 1 MODERATION 2016 MODERATION NOTEBOOK READING
CANTI NATALIZI (1) HTTPWWWPUERICANTORESVEDUGGIOITPAROLENATALE1HTML101209CHANTS ASTRO DEL CIEL TESTO E
 [ESCRIBA TEXTO] [ESCRIBA TEXTO] [ESCRIBA TEXTO] LOKATZAREN 40 URTEURRENEKO
