HOW ELTS WILL ACQUIRE THE FIRST SPECTRA OF ROCKY
1 CAN FOREIGNERS ACQUIRE OR LEASE LAND INABSTRACT OBJECTIVE THIS STUDY DESCRIBES THE ETIOLOGY OF COMMUNITYACQUIRED
ACQUIRENTE UNICO SPA AVVISO DI INDAGINE DI MERCATO PER
ACQUIRENTE UNICO SPA GARA PER LA PROGETTAZIONE REALIZZAZIONE E
ACUTE COMMUNITYACQUIRED PNEUMONIA SIMPLE CHOICE TEST (CS) CS 1
APPLICATION FORM TO IMPORT SUPPLY OR ACQUIRE HIGHPOWER LASER
Sample manuscript showing specifications and style
How ELTs will acquire the first spectra of rocky habitable planets
Olivier
Guyon*a,b,c,
Frantz Martinachea,
Eric Cadyd,
Ruslan Belikove,
Balasubramanian
Kunjithapathamd,
Daniel Wilsond,
Christophe Clergeona,
Mala Mateenc
aSubaru Telescope, National Astronomical Observatory of Japan, 650 N. A'ohoku Place, Hilo, HI 96720, USA;
bUniversity of Arizona, Steward Observatory, 933 N. Cherry Ave., Tucson, AZ 85721, USA;
cCollege of Optical Sciences, University of Arizona, Tucson, AZ 85721, USA;
dJet Propulsion Laboratory, California Institute of Technology, 4800 Oak Grove Drive, Pasadena, CA 91109, USA;
eNASA Ames Research Center, Moffet Field, Mountain View, CA 94035, USA
Abstract
ELTs will offer angular resolution around 10mas in the near-IR and unprecedented sensitivity. While direct imaging of Earth-like exoplanets around Sun-like stars will stay out of reach of ELTs, we show that habitable planets around nearby M-type main sequence stars can be directly imaged. For about 300 nearby M dwarfs, the angular separation at maximum elongation is at or beyond 1 λ/D in the near-IR for an ELT. The planet to star contrast is 1e-7 to 1e-8, similar to what the upcoming generation of Extreme-AO systems will achieve on 8-m telescopes, and the potential planets are sufficiently bright for near-IR spectroscopy. We show that the technological solutions required to achieve this goal exist. For example, the PIAACMC coronagraph can deliver full starlight rejection, 100% throughput and sub-λ/D IWA for the E-ELT, GMT and TMT pupils. A closely related coronagraph is part of SCExAO on Subaru. We conclude that large ground-based telescopes will acquire the first high quality spectra of habitable planets orbiting M-type stars, while future space mission(s) will later target F-G-K type stars.
Keywords: Exoplanets, Coronagraphy, Extreme-AO
1.Targets
In this section, the targets parameters that are relevant to evaluating detectability are established: angular separation, contrast, star and planet apparent luminosities. These quantities are then used in section 2 to discuss the detectability of potentially habitable planets, and form the basis for establishing coronagraphy and wavefront control requirements for this science case. Technological solutions and expected performance are discussed in section 3 (coronagraphy) and section 4 (wavefront control).
1.1Input catalog
In this section, we evaluate the expected photometric properties of rocky planets in the habitable zones of nearby stars. For simplicity, we consider planets with an albedo equal to 0.3, independent of wavelength, and with diameters exactly twice the Earth diameter (superEarths) unless noted otherwise. Planets are placed on circular orbits with semi-major axis equal to one astronomical unit multiplied by the square root of the star bolometric luminosity (relative to the Sun). The planet thus receives from its star the same total flux per unit of area as Earth. Observations of the planets are assumed to be at maximum elongation.
*guyon@naoj.org;
phone 1 818 292 8826
Three catalogs are used to construct the input target catalog:
The Gliese Catalog of Nearby Stars 3rd edition1 (CNS3) containing all stars known to be within 25 parsecs of the Sun as of 1991. This catalog is the primary source of targets for this work, and contains the position the spectral type, apparent magnitude (V band), colors (B-V, R-I) and parallax for each target.
Near-IR photometry is obtained from the 2MASS2 point source catalog.
The northern 8-parsec sample3 contains bolometric luminosities and colors (B-V, V-R, V-I) for targets in the 8-parsec sample and is used to establish empirical photometric relationships that can be applied to the full sample, as detailed in the next sections
1.2Star bolometric luminosity, planet angular separation and contrast
The bolometric correction, required to derive the bolometric luminosity of each star of the sample from its absolute magnitude in V band, is derived from the 8-pc sample, which does include, for each star, both the absolute V magnitude and the bolometric magnitude. Since the bolometric is mostly a function of stellar temperature, the bolometric correction is fitted as a function of B-V color for the 8-pc sample. Two separate fits are performed for respectively "blue" (B-V < 1.2) and "red" (B-V > 1.0) stars. The "blue" fit is used to derive bolometric luminosities for stars with B-V < 1.1, while the "red" fit is used for B-V > 1.1.
The bolometric luminosity (referenced to the Sun) for each star is then derived from the absolute magnitude MV and the bolometric correction BC:
|
Lbol = 2.51188643-(MV-4.83) + (BC - BCSun) |
|
with BCSun = -0.076.
The planet is then placed sqrt(Lbol) AU from the star, and its angular separation is computed using the star parallax. The reflected light contrast is then computed at maximum elongation assuming a 0.3 albedo. Results are shown in figure 1, and clearly demonstrate that there is a strong trade-off between angular separation and contrast.
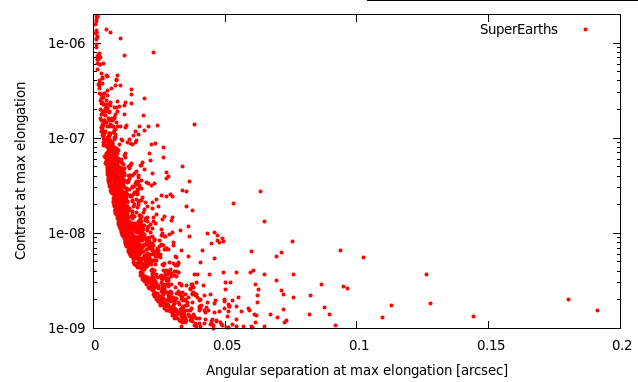
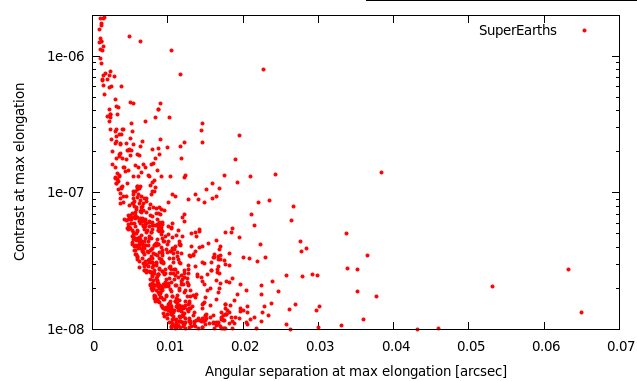
Figure 1. Left: Angular separation vs reflected light contrast for SuperEarths (2x Earth diameter), assuming each star in the sample has such a planet. Right: Planets with contrast above 1e-8 only.
1.3Apparent magnitudes in V, R, I, J, H and K bands
The apparent magnitude in the visible bands (V, R and I) are required to estimate how well an adaptive optics system can correct and calibrate the wavefront. These fluxes are therefore important to derive the detection contrast as a function of angular separation. The relationships between V-R, V-I and B-V colors are established using stars for which the 3 colors have been measured, and the relationships are then applied to stars for which only B-V has been measured.
Apparent J, H and K magnitudes for the stars are extracted from the 2MASS catalog. In the few cases (1% of the targets) where Gliese catalog entries do not have a match in the 2MASS catalog (usually because they are too faint or they are close companions), 4th order polynomial fits of the V-J, V-H and V-K colors as a function of B-V color are derived from the list of targets that are matched in both catalogs, and then applied to those for which no near-IR flux measurement exists. In this case, the standard deviation in the J, H, and K magnitudes are 0.36, 0.41 and 0.36 respectively (these values are sufficiently small to not significantly affect planet detectability estimates). Since the planet albedo is assumed independent of wavelength, the planet to star contrast in the near-IR is the same as computed for visible light. No thermal emission is assumed (this is a conservative assumption in K band).
2.Observability of Rocky planets in reflected light
2.1First cut at observation constraints for ELTs: identification of potential targets
We assume in this paper that scientific observations are performed in H band (central wavelength = 1.65 μm). Detectability of exoplanets with direct imaging is a driven by several effects, which are considered in this section to identify if habitable planets can be imaged and characterized with ELTs:
Angular separation. The separation must be sufficiently larger than the inner working angle (IWA) of the coronagraph in H band.
Contrast. The planet-to-star contrast must be above the detection limit, which is itself a function of both wavefront correction performance, coronagraph performance, PSF calibration accuracy, and uncorrelated noises (photon noise mostly).
Star brightness (R band). The star brightness has a strong impact on the wavefront correction quality: faint stars do not produce sufficient light for accurate and fast wavefront measurements.
Planet brightness (H band). The planet brightness must be above the photon-noise detection limit.
These detectability constraints are highly coupled. For example, the contrast limit is usually a steep function of the angular separation, and both the star brightness and planet brightness strongly affect the contrast limit. The interdependencies between these limits are function of the instrument design and choices (wavefront control techniques, observation wavelength). To easily identify how instrumental trades affect detectability of habitable exoplanets, first cut limits are first applied to construct a small list of potential targets.
The first cut limits are shown in table 1. The number of targets kept is mostly driven by the contrast and separation limits, and to a lesser extent by the planet brightness limit. The planet brightness limit is derived from a required SNR=10 detection in 10mn exposure in a 0.05 μm wide effective bandwidth (equivalent to a 15% efficiency for the whole H-band) on a 30-m diffraction limited telescope, taking into account only sky background and assuming all flux in a 20mas wide box is summed. The assumed sky background (continuum + emission) is mH = 14.4 mag/arcsec2.
Table 1. First cut limits applied to list of potential targets
|
Design |
Limit applied |
rationale |
|
Angular separation |
Must be > 1.0 λ/D = 11mas in H band |
Limit imposed by coronagraph (see section 3). |
|
Contrast |
Must be > 1e-8 |
High contrast imaging limit – similar to contrast limit for ExAO systems on 8 m class telescopes. |
|
Star brightness |
mR < 15 |
Required for high efficiency wavefront correction |
|
Planet brightness |
mH < 26.8 |
SNR=10 detection in 10mn with no starlight |
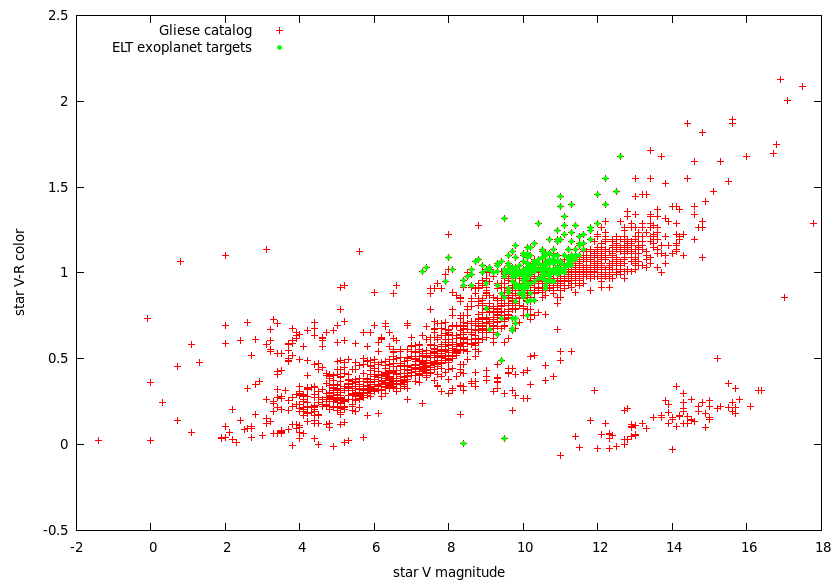
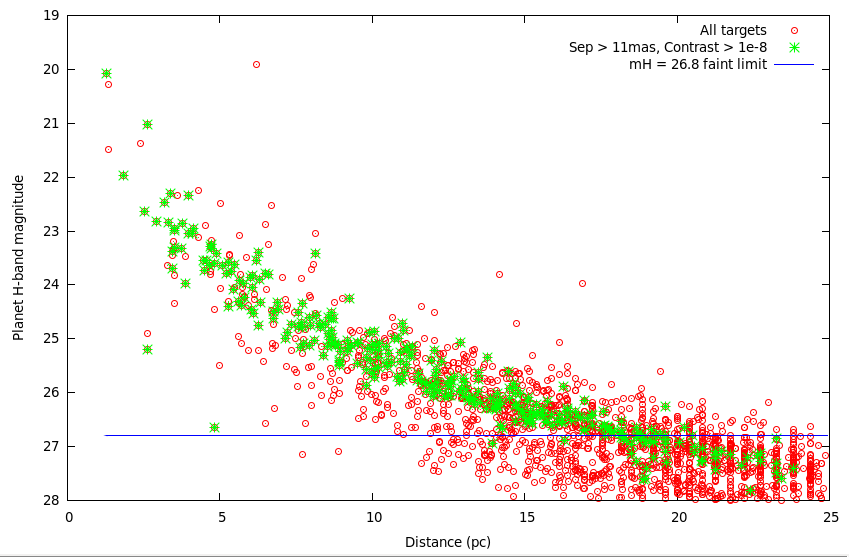
The target list after applying the first cut limit consists of 274 entries. Figure 2 shows that this lists consists mostly of relatively faint (mV~10) late-type (V-R ~ 1 to 1.5) main sequence stars. Two notable exceptions are the 40 Eri B and Sirius B white dwarfs, clearly visible in fig 2 as much bluer (V-R ~ 0) than the rest of the sample.
Figure
2. Full input catalog (red points) and target list after first cuts
are applied (green points) Top: Planet
apparent brightness in H-band as a function of system distance. The
mH=26.8 flux limit adopted excludes planets beyond approximately
20pc. Bottom: ELT exoplanet targets stars V band apparent brightness
and V-R color.
2.2Most favorable targets
The most favorable target, listed in the table below, were selected with the following criteria:
Angular separation at maximum elongation > 15 mas
Contrast > 1e-7
Planet brightness mH < 24, allowing spectroscopy
After applying these limits, the list of most favorable targets consists of 10 nearby late type main sequence stars (spectral types M3.5 to M6). While the contrast level and planet apparent luminosity are quite accessible with an ELT, the angular separation is below 40mas for all targets: none of these hypothetical exoplanets could be directly imaged with the current generation of 8-m to 10-m telescopes.
3.Coronagraphy
Section 2 shows that potentially habitable planets that may be accessible to ELTs are at very small angular separations (about 10 to 20 mas), at about 1e-7 contrast. In this section, we evaluate if coronagraphy can allow such detections on a ELT.
3.1Is coronagraphy essential ? What raw contrast is required ?
Coronagraphy is defined by its ability to physically separate planet light from starlight on the detector, but may not be the ideal technique to access small angular separations. Interferometric techniques, such as aperture masking4, are very capable of high contrast imaging at small angular separations, down to 1 λ/D (and sometimes even closer) and offer good calibration of residual starlight. We assume here that interferfometric techniques do not physically separate planet and starlight (this is true for aperture masking), and thus choose to define nulling techniques as coronagraphs.
To evaluate the suitability of interferometric technique, and more generally establish the raw conronagraphic contrast required, we must quantify how much starlight can be physically mixed with planet light to allow detection in the photon-noise limit. We assume a that an Earth like planet is observed around a M type star at 5pc with a 30 m telescope. The planet apparent brightness is mH=25.2, and the star/planet contrast is 3.6e7 (the star is mH=6.3). Other assumptions are: a mH=14.4 arcsec-2 background, a 20masx20mas aperture for photometry, a 15% efficiency (coatings, detector), a 0.3 μm wide bandpass (H band) and a 1hr exposure.
Table 2. Photon-noise limited signal-to-noise ratio (SNR) in H band for different observing configurations
|
|
Detection SNR, H band (R~5) |
Spectroscopy SNR, R=100 |
|
Starlight perfectly removed |
Earth: 102; Super-Earth: 356 |
Earth: 23.5; Super-Earth: 83 |
|
Coronagraphy, 1e5 raw contrast |
Earth: 16.31; Super-Earth: 65 |
Earth: 3.8; Super-Earth: 15 |
|
Coronagraphy, 1e4 raw contrast |
Earth: 5.16; Super-Earth: 20.6 |
Earth: 1.2; Super-Earth: 4.8 |
|
Interferometry, 100% efficiency |
Earth: 0.05; Super-Earth: 0.2 |
Earth: << 1; Super-Earth:<< 1 |
Results are shown in table 2 for different scenarios. The first case “starlight perfectly removed” only include photon noise from the planet and sky background, showing that R=100 spectroscopy of an Earth could be done at SNR = 23.5 in one hour. The next two entries show the SNRs for two raw contrast values, and the last entries assumes that there is no separation between starlight and planet light, but that the technique used is 100% efficient (same assumption as for coronagraphy – the full pupil is used). The table shows that the coronagraph must reach at least 1e4 raw contrast (preferably 1e5) to be able to detect and characterize rocky planets, and that interferometry is not a suitable approach due to excessive photon noise from the starlight.
3.2How close can coronagraphs get to the star ?
While many high performance coronagraph concepts exist5, we focus in this section in one particular concept that offers sub-λ/D inner working angle with full efficiency and no limit in contrast other than the limit imposed wavefront errors. The concept, the PIAACMC (Phase-Induced Amplitude Apodization Complex Mask Coronagraph) is also compatible with segmented and centrally obscured apertures, and therefore seems ideally suited for the science goal described in this paper. Other coronagraph concepts may also be suitable, and we only describe the PIAACMC here as proof of existence of a coronagraph that can enable direct imaging and spectroscopy of habitable planets with ELTs.
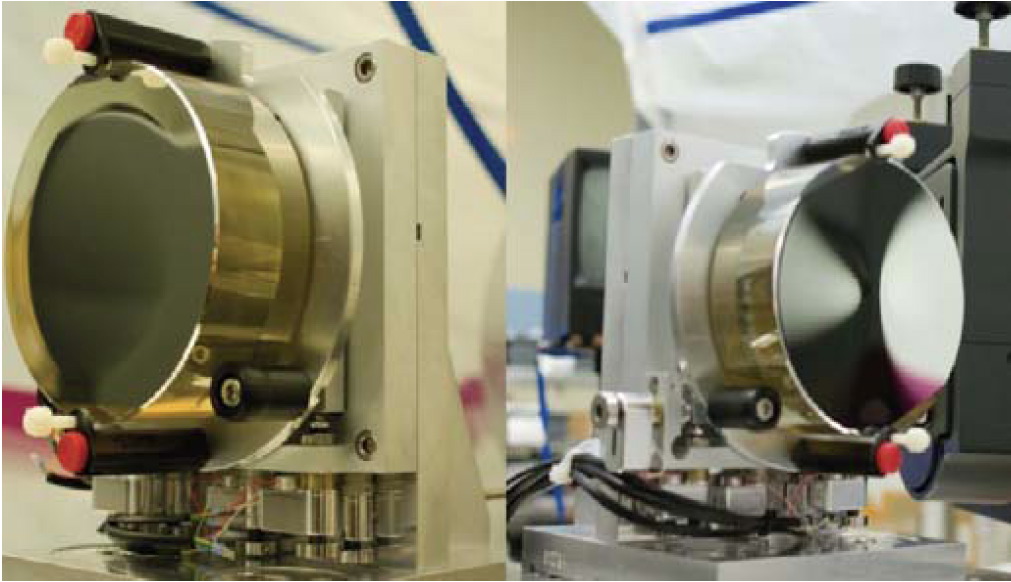
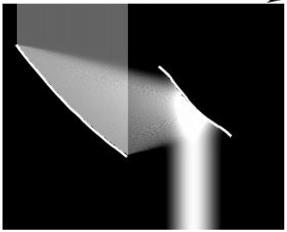
Figure 3. Phase-Induced Amplitude Apodization (PIAA) technique (left): aspheric optics are used to apodize the telescope beam without light loss. Right: Set of PIAA mirrors, Zerodur substrate, manufactured by L3-Tinsley
The
PIAACMC is an improvement over the more conventional PIAA
coronagraph6-13,
where the lossless apodization – shown in figure 3 – is
used to produce a PSF with minimal diffraction wings. The central
bright part of this PSF is then blocked by an opaque focal plane mask
to remove starlight while preserving light from nearby sources. An
inverse PIAA set may then be used to recover a sharp
diffraction-limited image over a useful field of view. The same
lossless PIAA technique can also be used to replace the apodizer in
coronagraph architectures where the starlight rejection is shared
between several components (instead of relying entirely on the opaque
focal plane mask). This leads to PIAA coronagraph types with higher
performance, as the flexibility of using several masks for starlight
rejection opens new possibilities. For example, an apodized pupil
Lyot coronagraph (APLC) configuration with a PIAA front end is
especially attractive, as the full throughput apodization of the PIAA
optics greatly enhances the APLC’s performance14.
Performance can be further improved by allowing the focal plane mask
to be smaller, partially transmissive and phase-shifting. This allows
total on-axis coronagraphic extinction, and a very small IWA. This
approach, shown in figure 4, is referred to as the PIAA Complex Mask
Coronagraph (PIAACMC). The PIAACMC concept14
is, theoretically, the highest performance coronagraph, as it can
fully suppress starlight (contrast entirely limited by wavefront
control and man
ufacturing
limits) with an inner working angle equal to 0.64 λ/D.
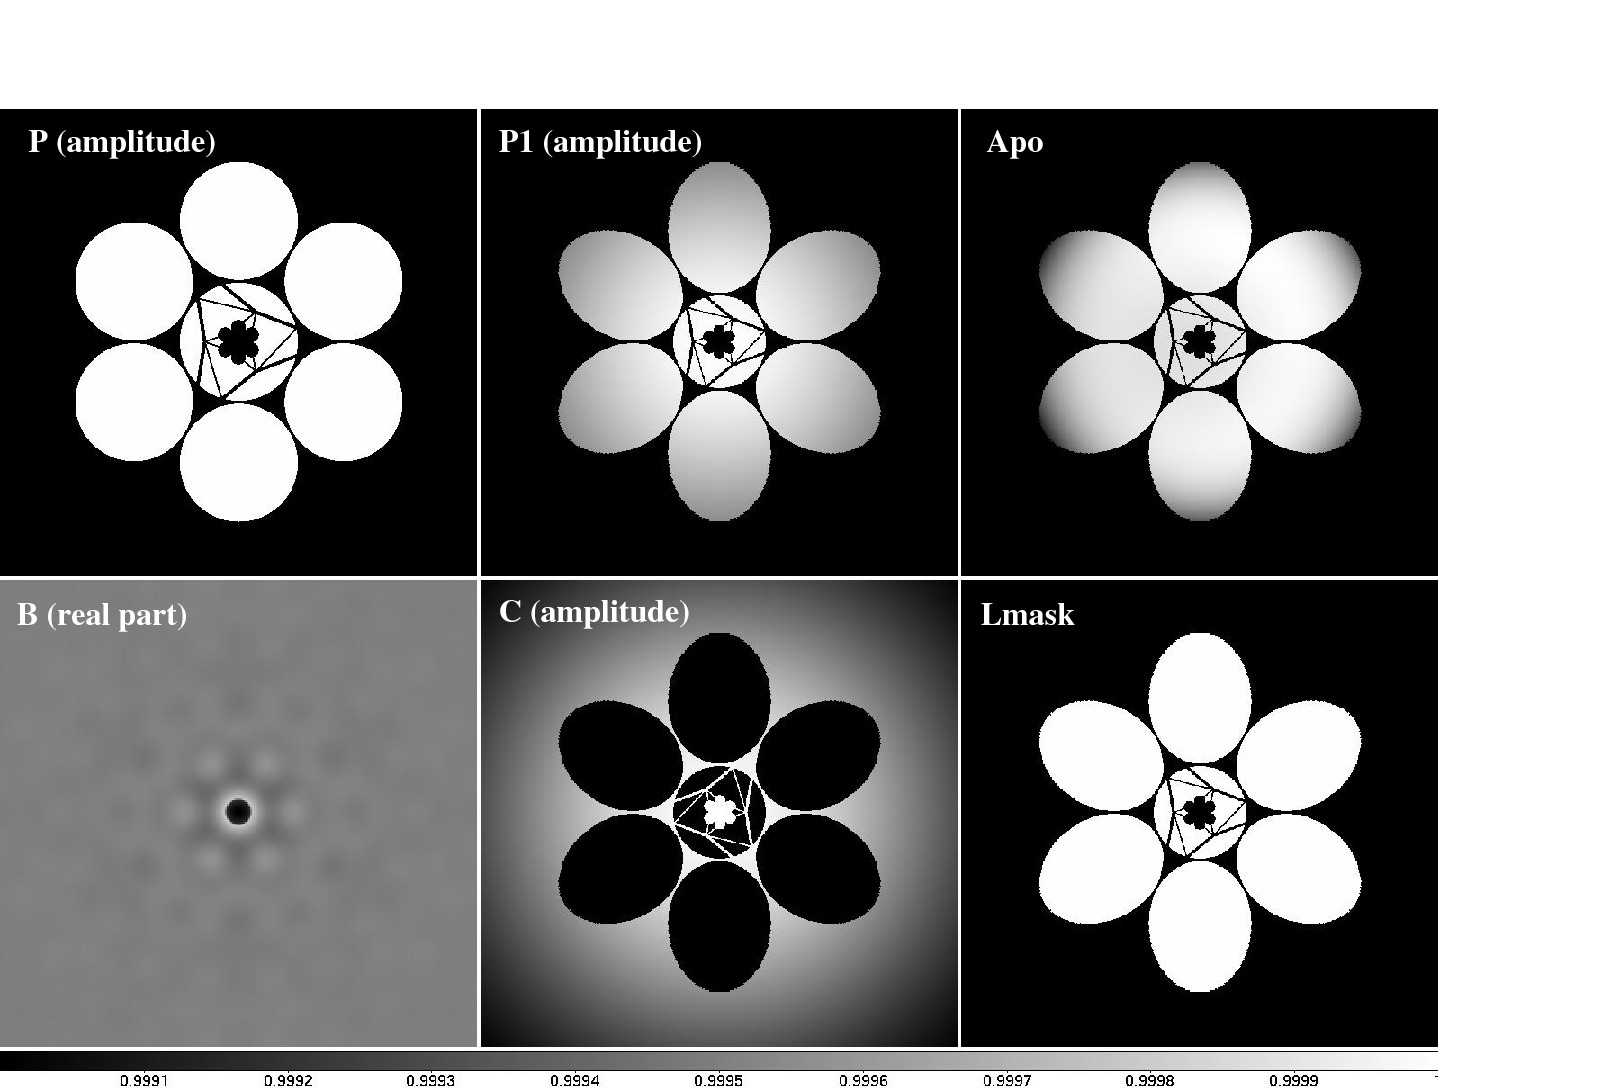
Figure
4.
Left: The PIAACMC concept uses lossless apodization and a
phase-shifting focal plane mask in a Lyot coronagraph configuration.
Right: PIAACMC is compatible with segmented apertures, regardless of
the number of segments or the pupil geometry. Bottom: For ELT pupil
geometries, as well as for monolithic pupils, the PIAACMC delivers
sub-λ/D
IWA and full throughput.
As shown in figure 4, the PIAACMC concept is compatible with the segmented and centrally obscured apertures of future ELTs. Figure 5 demonstrates that there is no loss of performance associated with its use on such apertures, and that sub-λ/D IWA is achievable with full efficiency.
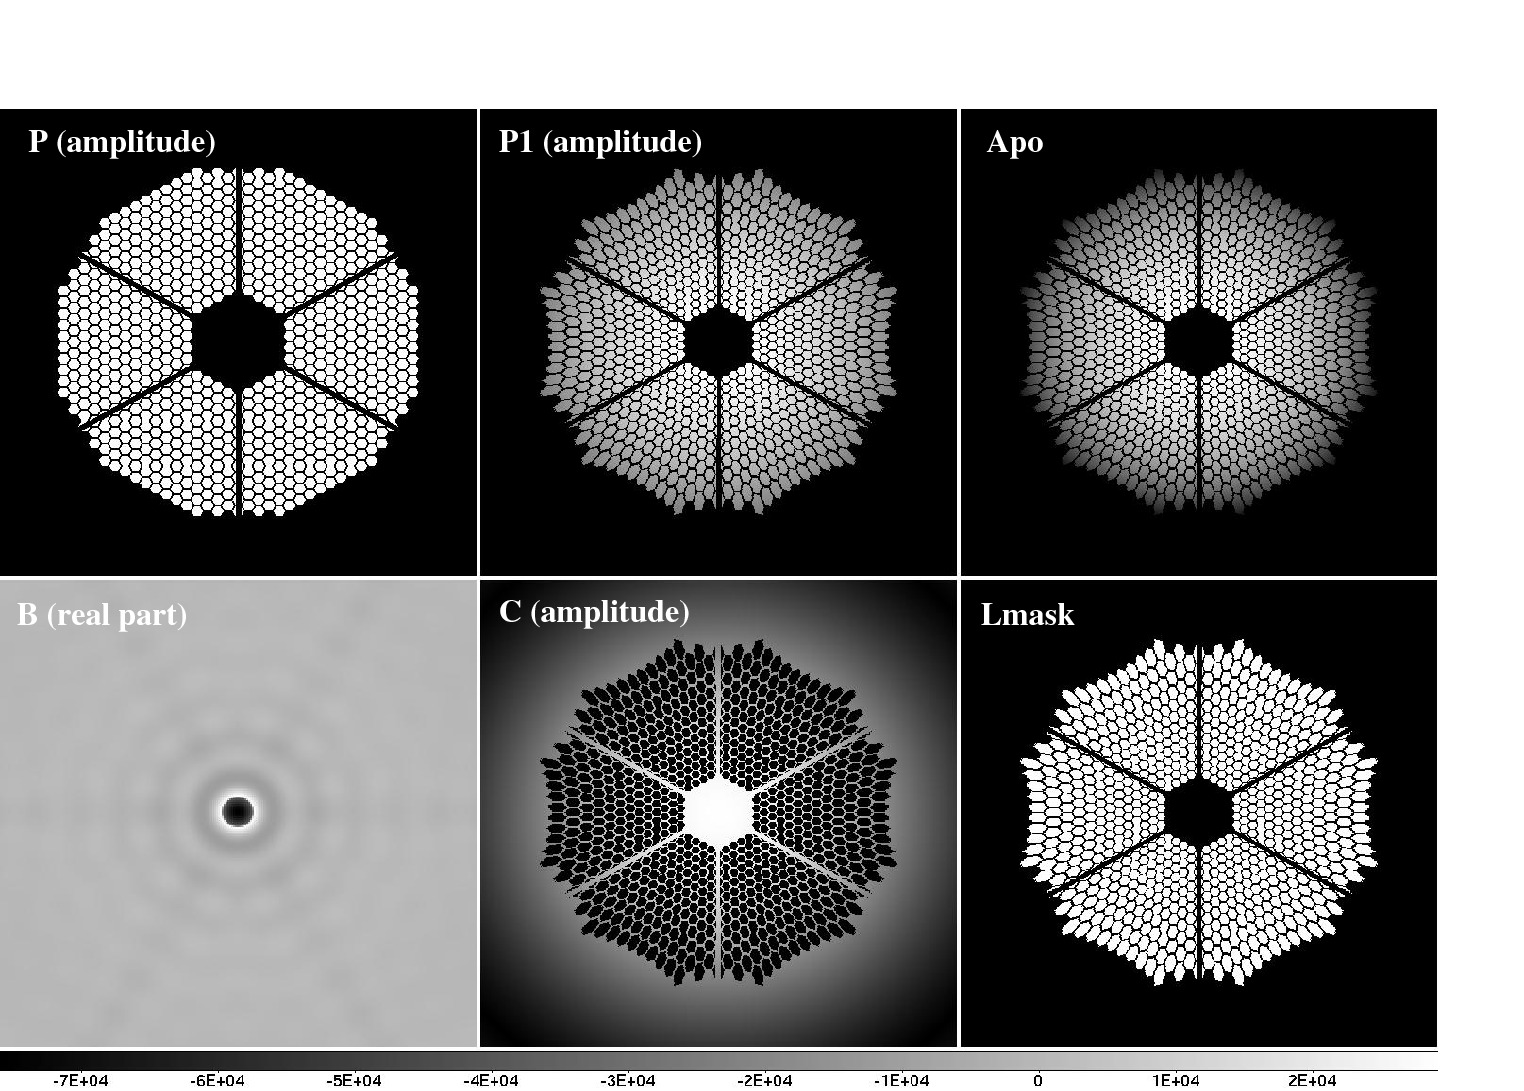
Figure
5.
For ELT pupil geometries, as well as for monolithic pupils, the
PIAACMC delivers sub-λ/D
IWA and full throughput.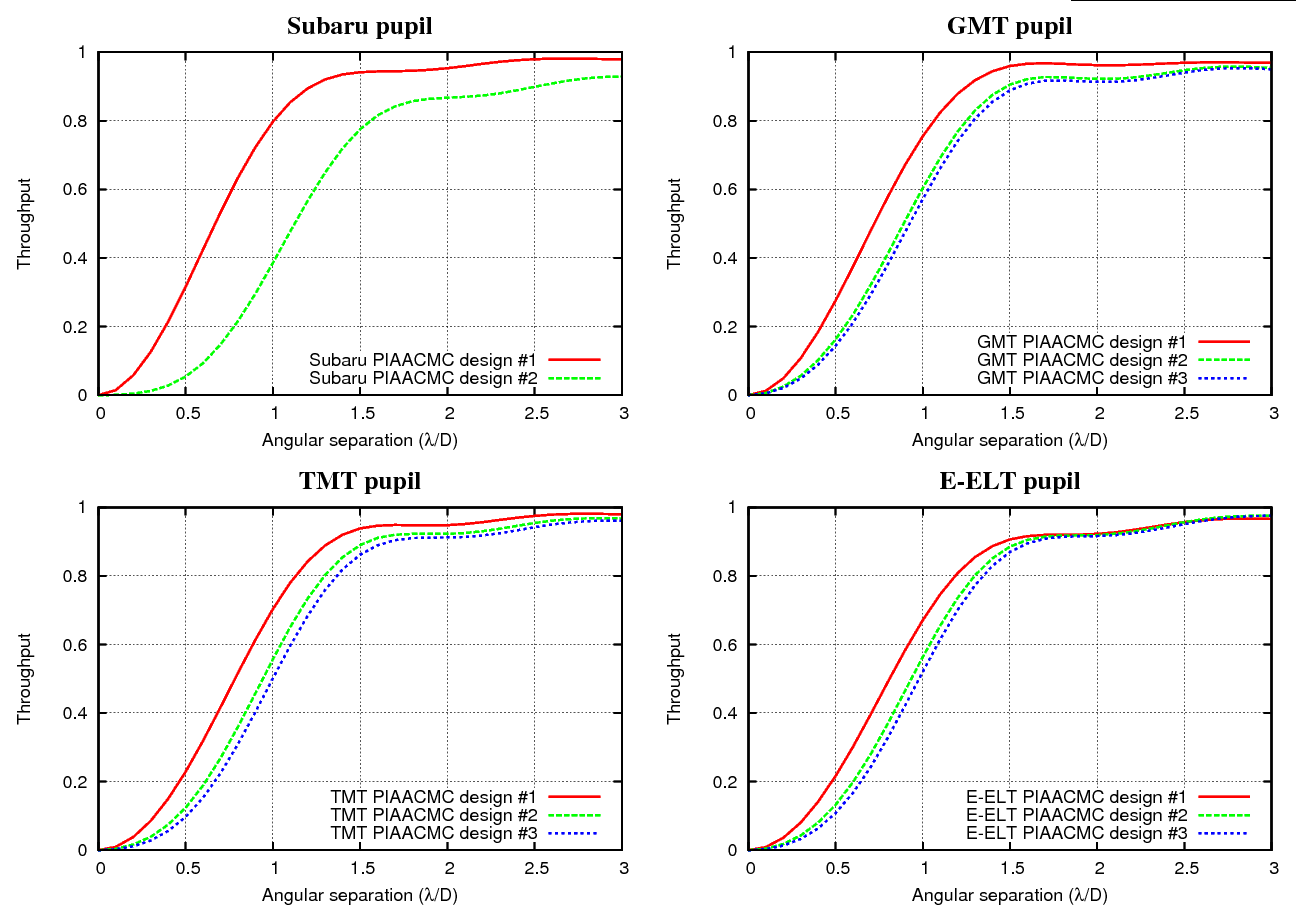
3.3Limit imposed by stellar angular size
F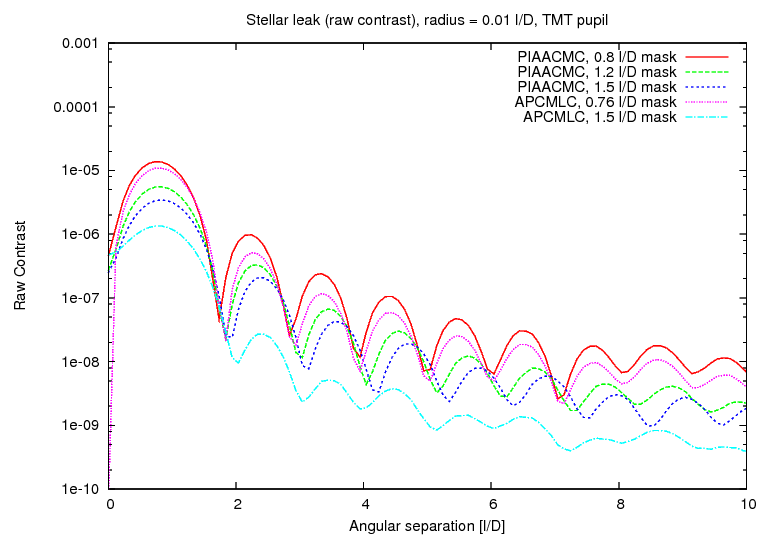
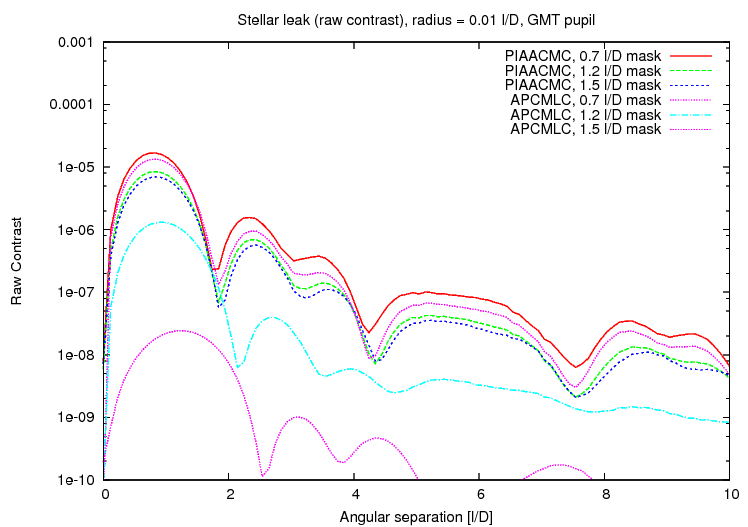
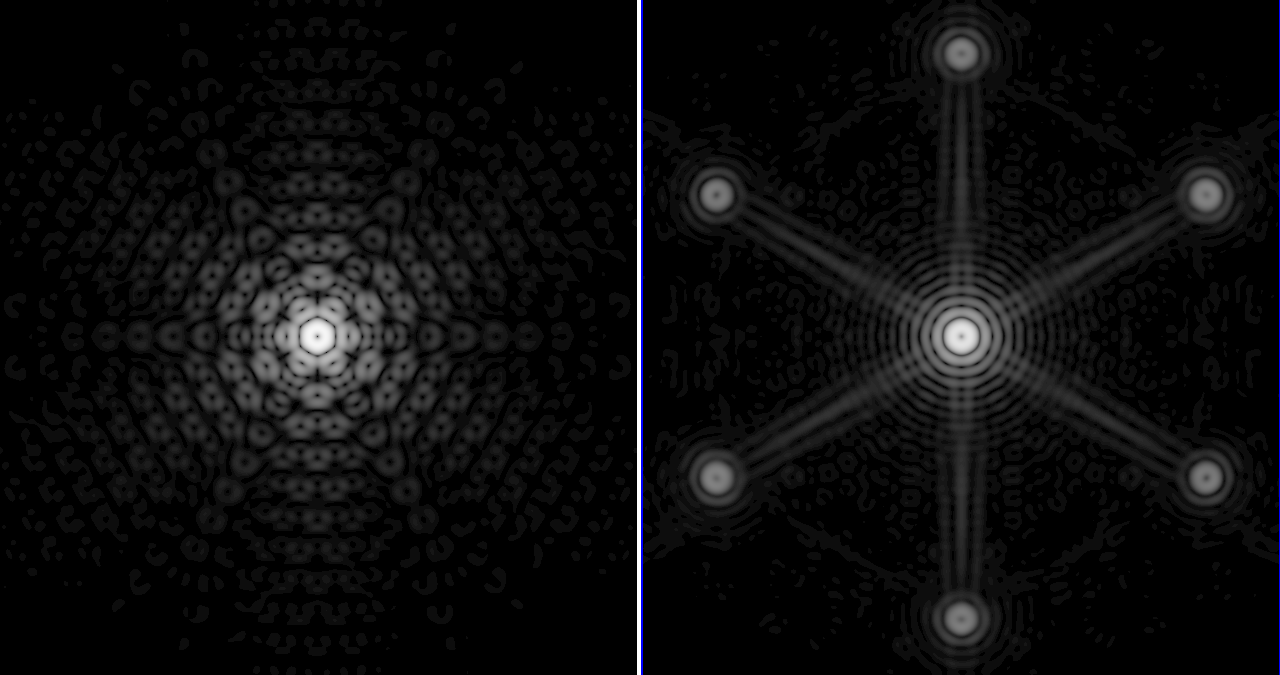
igure
6. Radial profile of coronagraphic leaks due to stellar angular size
for the GMT pupil (left) and TMT pupil (right). Bottom image: Images
showing the coronagraphic
leak due to stellar angular size for the TMT (left) and GMT (right)
pupil, for a 0.01 λ/D
radius stellar disk and a PIAACMC coronagraph with a a/2 = 1.5
λ/Dsyst
mask (IWA = 0.92 λ/D
for GMT, and 0.99 λ/D
for TMT).
Coronagraphic leaks due to stellar angular diameter can be numerically subtracted from the science image, but will contribute photon noise. For ground-based detection of high contrast planets, the most challenging science goal is the direct imaging of reflected light exoplanets in the habitable zone of nearby M-type stars. The planet-to-star angular separation is then between 10mas and 20mas, and the contrast for a 2x Earth diameter planet is approximately 1e-7. The stellar diameter is typically around 0.01 λ/D (a late M-type star with a 0.2 Sun radius size at 10 pc is 0.1 mas radius) and the stellar leak is then at the ~1e-5 raw contrast level. This level of stellar leak is approximately equal to the raw contrast contribution of residual atmospheric speckles after an Extreme-AO system, so stellar leak is not expected to be the dominant contributor in the detection error budget, and the most aggressive small IWA coronagraph designs may be employed on ground-based ELTs.
3.4Coronagraph chromaticity
Managing chromatic effects is essential in the PIAACMC: the focal plane mask is required to introduce both a phase offset and a partial transmission – both of which need to be well controlled as a function of wavelength. The mask size is also critical, as, unlike the conventional PIAA coronagraph, its role is not simply to block starlight: the right amount of starlight needs to fall within the mask so that it can destructively interfere with light outside the focal plane mask.
At the 1e-4 to 1e-5 raw contrast level for this science goal, the chromaticity challenge is not as serious as it is for the high contrast (~1e-9 raw contrast) that is required for space-based coronagraph. In a 10% wide band, a simple monochromatic PIAACMC design will reach the 1e-5 raw contrast level, and achromatization is therefore only required for larger spectral coverage. One approach to solving this challenge for space based coronagraphs is to design a focal plane mask which maintains constant complex amplitude (phase, amplitude) across the desired spectral range but changes size linearly with wavelength. The mask can be designed as a zeroth order diffraction grating consisting of multiple cells, each smaller than λ/D. This solutions is directly applicable to the science goal presented in this paper. A simpler approach is the dual zone phase mask coronagraph15, which may be extended to more than two zones if needed.
4.Wavefront control
4.1Pointing control (and calibration)
A key challenge of high contrast imaging near 1 λ/D is the need for exquisite control of pointing and low order aberrations. A coronagraph operating at 1 λ/D is much more sensitive to pointing errors than a larger-IWA coronagraph. There are two fundamental requirements that need to be satisfied :
Pointing jitter needs to be sufficiently small to allow detection and characterization of exoplanets in the presence of the photon noise created by coronagraphic leaks. For a 1e-5 allowable raw contrast at the coronagraph's IWA, the pointing jitter should be no more than about two percent of the telescope diffraction limit, or 0.2 mas. This is similar to the angular radius of most stars in the sample: the largest angular radius in the top targets is 0.5mas (Proxima Centauri), so reducing the pointing jitter below 0.2 mas will in fact not bring significant performance improvement, as the coronagraph will be designed to tolerate this level of jitter in order to accommodate stellar angular size.
Pointing calibration on longer timescales should be accurate to about 0.01 mas to support 1e-8 calibrated contrast level.
One approach for accomplishing the goals listed above is to implement and operate a dedicated sensor, the Coronagraphic Low-Order Wave-Front Sensor16 (CLOWFS), which uses starlight otherwise rejected by the coronagraph. Using the light that falls on the central (within the coronagraph IWA) part of the focal plane mask offers two fundamental advantages over schemes relying on analysis of coronagraphic science images for pointing control:
• A large number of photons is available for the measurement, allowing fast and accurate tip-tilt estimation
• Pointing errors can be measured before they start producing coronagraphic leaks in the science image
The CLOWFS was used to control pointing at the 1e-3 λ/D level in a testbed at the Subaru Telescope16. In a more recent demonstration at JPL, RMS pointing error was reduced by a factor 81, from 87e-3 λ/D to 1.07e-3 λ/D, and the CLOWFS accuracy was verified to be at or below 1e-4 λ/D. These levels of control are well beyond what is required to image habitable planets with ELTs, but were obtained in laboratories where disturbances are slow. The CLOWFS on an ELT would require a fast frame rate camera to obtain similar results. The CLOWFS was also shown to provide calibration of residual pointing errors, and can be used to separately estimate coronagraphic leaks due to pointing errors with a ~1% accuracy17.
4.2Fast wavefront sensing strategy: optimal wavelength
The ELT exoplanet target stars are fainter than traditional extreme-AO targets, as shown in figure 7. They are typically mV=11 and mI=10, and are therefore also quite red. It is therefore important to identify a wavefront sensing that makes efficient use of available photon. In this section, we discuss the optimal choice of wavelength for such a sensor.
Figure
7. Planet contrast as a function of star I-band magnitudes for the
ELT exoplanet sample and the top targets. The 10 most favorable
targets are show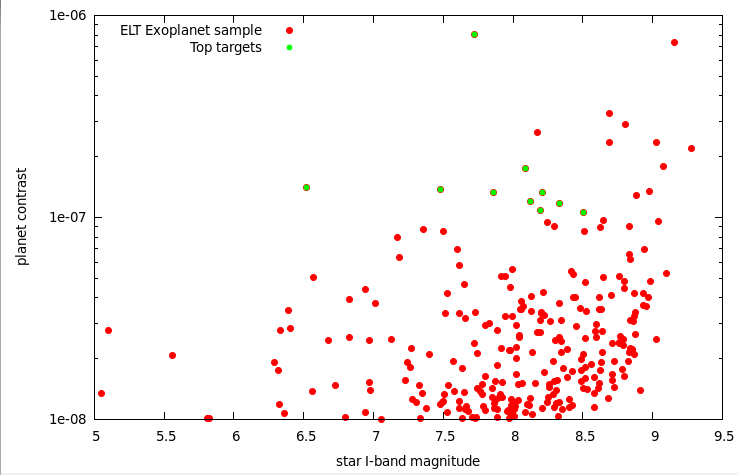
n
in green.
The photon-noise wavefront sensing precision is a function of the total number of photon available for the measurement and the wavelength: the measurement error is proportional to 1/(sqrt(Nph) λWFS). The relative sensitivity between two colors λ1 and λ2, in the photon noise limited regime for a constant spectral bandwidth, is therefore:
|
S(λ1,λ2) = λ2/λ1 sqrt(zp1/zp2) 2.51188643(m2-m1)/2 |
|
Where zp1 and zp2 are the magnitude scale zero points at λ1 and λ2. m1 and m2 are the magnitudes at λ1 and λ2. The S(λ1,λ2) is greater than 1 if wavefront sensing is more precise at λ1 than at λ2. Since the typical targets for this science case have V-R=1.3, V-I=3.0 and V-H=5.0 colors, the equation above gives:
|
S(V,R) = 0.76 |
|
||
|
S(V,I) = 0.546 |
|
||
|
S(V,H) = 0.97 |
|
||
The targets are therefore sufficiently red for I-band to be significantly better for wavefront sensing than V band, and the performance in R band wavefront sensing is intermediate. The photon-noise limited wavefront measurement error in I band is close to being half what it would be if V band was used. In addition to this photon-noise advantage, I-band wavefront sensing minimizes chromatic non-common path errors with the near-IR scientific imaging wavelength, while allowing non-overlapping spectral bands between wavefront sensing and scientific imaging. Interestingly, even if low-noise fast detectors were available in the near-IR, it is not as good for wavefront sensing as I-band, as the increased number of photon in the near-IR is not sufficient to compensate the longer wavelength. It is thus assumed in this study that wavefront sensing is performed in I-band, where low noise high QE fast detectors exist.
4.3Expected contrast
F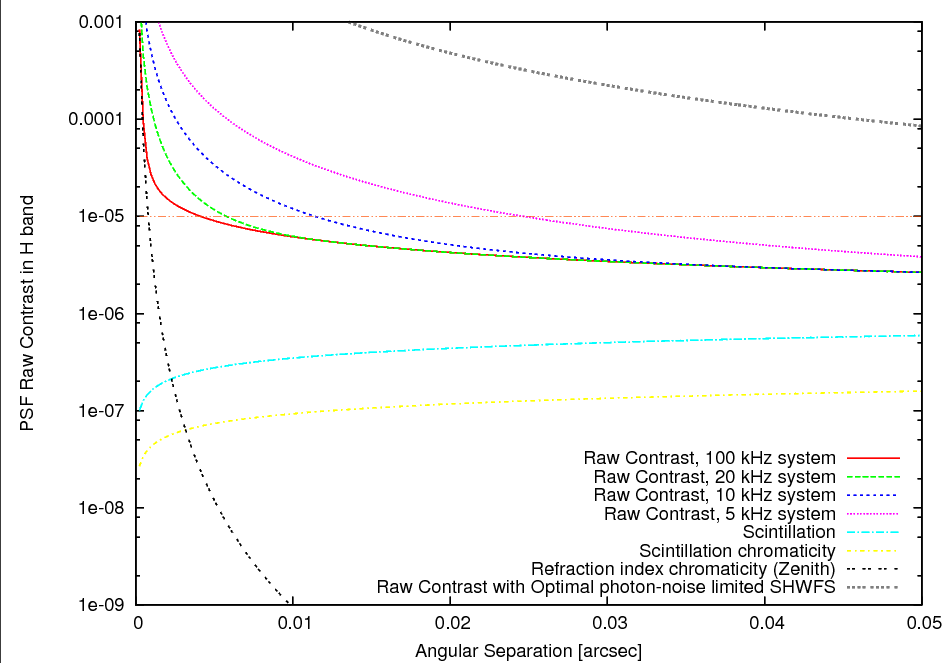
igure
8. Expected raw PSF contrast for a mI=8 target. See text for details.
The raw PSF contrast is estimated in Figure 8 for a mI=8.5 target. In the 10 to 20 mas angular separation range where most of the exoplanets are imaged, the contrast is limited by time lag in the loop and photon noise, and the other fundamental limits to raw contrast (scintillation and atmospheric chromaticity effects) are much smaller. With a high efficiency wavefront sensor able to take advantage of the telescope's diffraction limit, the expected raw PSF contrast at these small separations is approximately 1e-5, provided that the servo lag is no more than about 0.1 ms. This unusually low servo lag can be achieved with a high WFS sampling frequency (>10 kHz), and/or the use of predictive wavefront control techniques. Figure 8 also shows that a seeing-limited WFS such as the SHWFS is very inefficient at these small angular separations18, and would be a poor choice for the system, even if it operates at its photon-noise limit with no loop servo lag other than the one imposed by photon noise. Much better choices include the Pyramid wavefront sensor (with little or no modulation) and the non-linear Curvature WFS19, currently under development, and soon to be tested on sky on the Subaru Telescope and the 6.5 m MMT telescope.
The analytical model used to estimate raw contrast was also tested for an 8 m diameter telescope under the same conditions. For a 1 kHz system with a diffraction-limited wavefront sensor on an 8 m telescope, the raw contrast at 0.1" is 3e-4 (limited by servo lag), and it is 3e-5 at 0.5". These numbers are consistent with the goals of the future Extreme-AO systems on such telescopes. The detection contrast limit is more difficult to estimate for this system, as a range of PSF calibration techniques could be used (spectral or polarimetric differentiation for example). For simplicity, it is assumed here that spectral or polarimetric PSF calibration techniques are not used, and that the detection limit is imposed by speckle structure in the long-exposure image and photon noise. It is also assumed that static and slow speckles that are not due to the atmosphere are removed by focal plane wavefront control, a scheme that has already demonstrate control and removal of static coherent speckles at the 3e-9 contrast level in the presence of much stronger dynamic speckles.
The PSF halo consists of rapid atmospheric speckles at the 1e-5 contrast level with a lifetime of no more than one millisecond (speckles of longer duration are suppressed by the AO loop). In a one-hour observation, this fast component can thus average to 5e-9 contrast assuming that the AO system has removed correlation on timescales above 1ms. In addition to these fast speckles, chromatic non-common path errors and scintillation create a speckle halo contribution at the 1e-6 contrast level. Since this component is not controlled by the AO system, its coherence time is longer, at up to about 100ms in the near-IR. A 1-hr long observation will average this component by a factor ~200, to 5e-9 contrast level. Finally, photon noise in a 1-hr exposure for a mH star and a 1e-5 raw contrast will set a 1e-9 contrast limit for a 0.05 μm effective spectral bandwidth. Combined together, the 3 effects lead to a detection contrast limit just below 1e-8 for a 1hr long exposure.
4.4Possible system architecture
A possible system architecture is shown in figure 9, and designed to be as simple as possible while meeting the requirements listed above. Its main characteristics are:
Given that the ExAO system needs to operate fast (10 kHz or faster) but does not need to clean the PSF halo over a large range of angles, it consists of a ultra fast low actuator count system (~12 x 12 actuators) placed after a conventional facility AO system. The conventional AO system's role is to provide a diffraction-limited PSF, and will require many actuators for an ELT, but can run relatively slowly (~kHz). The ExAO system achieves its speed and sensitivity over a small number of modes to keep its computational bandwidth and pixel read rate manageable. This architecture (slow tweeter followed by fast woofer) is opposite to current ExAO systems for which the second AO layer has a higher actuator count.
Since the two AO system have different functions and very different temporal bandwidth, there is no need for communication between the two systems. The planet imaging instrument does therefore not need to interface with the facility AO system, simplifying development, testing and operation.
A fast sensor dedicated to pointing and focus is implemented within the coronagraph.
The coronagraph allows direct imaging at λ/D inner working angle
The science camera - an integral field spectrograph - is designed for fast readout, compromising with field of view and spectral resolution. The fast readout (second or faster) allows efficient active suppression of slow speckles that are due to non-common path errors in the system.
Figure
9.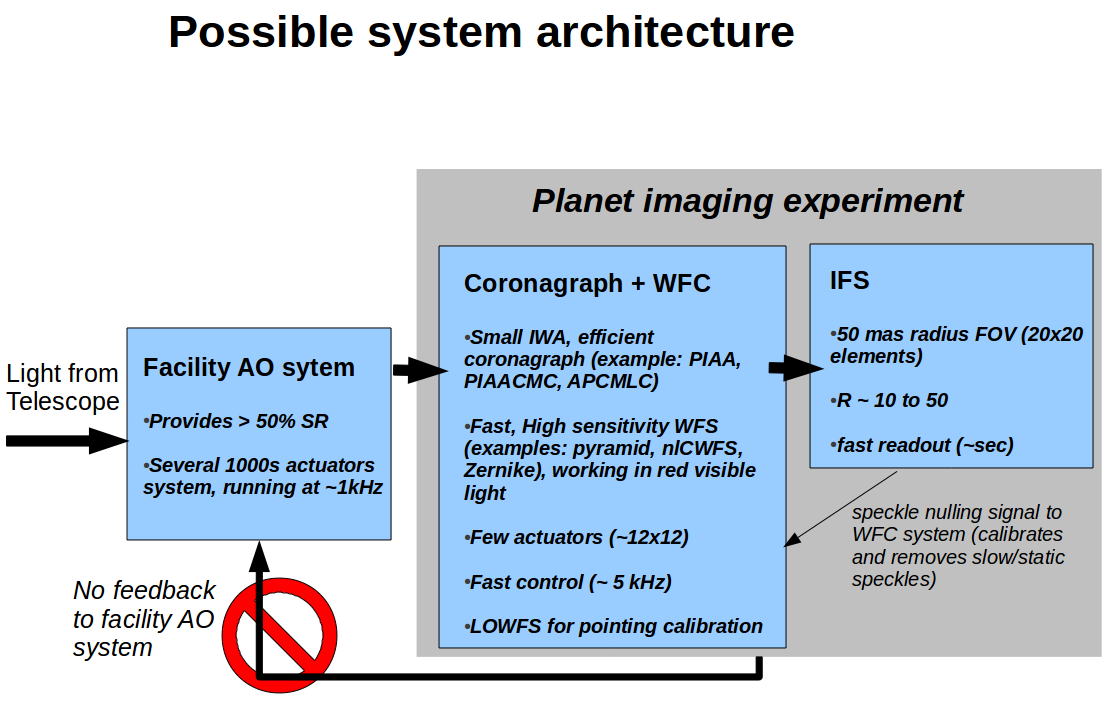
Possible system architecture for a focused instrument aimed at direct
imaging and low resolution spectroscopy of habitable planets with an
ELT.
5.conclusions
Direct imaging of habitable planets around nearby M-type stars with ELTs appears to be feasible thanks to new techniques that allow high contrast imaging at small angular separation. While these planets are too close to be resolved by current telescopes, an ELT able to acquire high contrast imaging in the 10mas to 30mas separation range can image them, and their relatively high brightness would allow for spectroscopic investigations. For the top targets, Earth-size habitable exoplanet may even be detected.
The technologies required to achieve this goal exist, even though several key technologies have only recently been identified and not yet demonstrated at the required performance level in laboratories or on sky. The next decade will be extremely valuable to mature these techniques toward an integrated system that can be ready when ELTs begin science operations. Experimental systems on 8-m telescopes, such as the Subaru Coronagraphic Extreme-AO20 (SCExAO) instrument, are rapidly maturing the techniques proposed required for this goal, and should continue to do so through this decade. Given the unusual requirements of such a system and the relatively small number of targets, a focused instrument (more akin to a science experiment than a facility instrument) should be developed instead of a general purpose extreme-AO system similar to the current generation of ExAO systems on 8 m class telescopes. This would allow for a relatively simple system with a rapid development schedule and moderate cost - an approach that would allow ELTs to acquire the first high quality spectra of nearby M-type habitable planets. This science goal is complementary to future space mission operating in visible light, which will need to target exoplanets at more challenging contrast levels around Sun-like stars due to limited angular resolution.
References
Gliese, W., and Jahreiss, H., “Nearby Stars, Preliminary 3rd Version,” VizieR On-line Data Catalog: V/70A (1995)
Skrutskie, M. F., Cutri, R. M., Stiening, R., Weinberg, M. D., Schneider, S., Carpenter, J. M., Beichman, C., Capps, R., Chester, T., Elias, J., Huchra, J., Liebert, J., Lonsdale, C., Monet, D. G., Price, S., Seitzer, P., Jarrett, T., Kirkpatrick, J. D., Gizis, J. E., Howard, E., Evans, T., Fowler, J., Fullmer, L., Hurt, R., Light, R., Kopan, E. L., Marsh, K. A., McCallon, H. L., Tam, R., Van Dyk, S., and Wheelock, S., “The Two Micron All Sky Survey (2MASS),” ApJ, Volume 131, pp. 1163-1183 (2006)
Reid, I. Neill, Hawley, Suzanne L., and Gizis, John E., “The Palomar/MSU Nearby-Star Spectroscopic Survey. I. The Northern M Dwarfs -Bandstrengths and Kinematics”, Astronomical Journal v.110, p.1838 (1995)
Lacour, S., Tuthill, P., Amico, P., Ireland, M., Ehrenreich, D., Huelamo, N., and Lagrange, A.M., "Sparse aperture masking at the VLT. I. Faint companion detection limits for the two debris disk stars HD 92945 and HD 141569," A&A 532, L72 (2011)
Guyon, O., Pluzhnik, E. A., Kuchner, M. J., Collins, B., and Ridgway, S. T., “Theoretical Limits on Extrasolar Terrestrial Planet Detection with Coronagraphs,” ApJS 167, 81–99 (2006).
Guyon, O., “Phase-induced amplitude apodization of telescope pupils for extrasolar terrestrial planet imaging,” A&A 404, pp 379–387 (2003).
Traub, W. A. and Vanderbei, R. J., “Two-Mirror Apodization for High-Contrast Imaging,” ApJ 599, 695-701 (2003).
Guyon, O., Pluzhnik, E. A., Galicher, R., Martinache, F., Ridgway, S. T., and Woodruff, R. A., “Exoplanet Imaging with a Phase-induced Amplitude Apodization Coronagraph. I. Principle,” ApJ 622, 744–758 (2005).
Vanderbei, R. J. and Traub, W. A., “Pupil Mapping in Two Dimensions for High-Contrast Imaging,” ApJ 626, 1079–1090 (2005).
Vanderbei, R. J., “Diffraction Analysis of Two-dimensional Pupil Mapping for High-Contrast Imaging,” ApJ 636, 528–543 (2006).
Martinache, F., Guyon, O., Pluzhnik, E. A., Galicher, R., and Ridgway, S. T., “Exoplanet Imaging with a Phase-induced Amplitude Apodization Coronograph. II. Performance,” ApJ 639, 1129–1137 (2006).
Pluzhnik, E. A., Guyon, O., Ridgway, S. T., Martinache, F., Woodruff, R. A., Blain, C., and Galicher, R., “Exoplanet Imaging with a Phase-induced Amplitude Apodization Coronagraph. III. Diffraction Effects and Coronagraph Design,” ApJ 644, 1246–1257 (2006).
Belikov, R., Kasdin, N. J., and Vanderbei, R. J., “Diffraction-based Sensitivity Analysis of Apodized Pupil mapping Systems,” ApJ 652, 833–844 (2006).
Guyon, O., Martinache, F., Belikov, R., and Soummer, R., “High Performance PIAA Coronagraphy with Complex Amplitude Focal Plane Masks,” ApJS 190, 220–232 (2010).
Soummer, R., Dohlen, K., and Aime, C., "Achromatic dual-zone phase mask stellar coronagraph,", A&A, vol 403, pp 369-381 (2003)
Guyon, O., Matsuo, T., and Angel, R., “Coronagraphic Low-Order Wave-Front Sensor: Principle and Application to a Phase-Induced Amplitude Coronagraph,” ApJ 693, 75–84 (2009).
Vogt, Frédéric P. A., Martinache, Frantz, Guyon, Olivier, Yoshikawa, Takashi, Yokochi, Kaito, Garrel, Vincent, and Matsuo, Taro, "Coronagraphic Low-Order Wavefront Sensor: Postprocessing Sensitivity Enhancer for High-Performance Coronagraphs," PASP, 123, pp.1434-1441 (2011)
Guyon, O., "Limits of Adaptive Optics for High-Contrast Imaging", ApJ, 629, pp. 592-614 (2005)
Guyon, O., "High Sensitivity Wavefront Sensing with a Nonlinear Curvature Wavefront Sensor," PASP, Volume 122, issue 887, pp. 49-62 (2010)
Martinache, F., Guyon, O., Clergeon, C. S., Garrel, V., “The Subaru coronagraphic extreme-AO project: first observations,” Society of Photo-Optical Instrumentation Engineers (SPIE) Conference Series 8847 (2012).
B ASIC PROJECT REHABILITATION AND OLDER PEOPLE WITH ACQUIRED
BUILD ON EXISTING KNOWLEDGE TO UPGRADE OR ACQUIRE SKILLS
CITY OF EASTPORT “BID NOTICE” TAX ACQUIRED PROPERTIES
Tags: acquire the, to acquire, acquire, rocky, spectra, first
- CS265 CRYPTOGRAPHY AND NETWORK SECURITY PROJECT ON ZEROKNOWLEDGE PROOFS
- RESOURCES AND CITATIONS OIG COMPLIANCE GUIDANCE HTTPOIGHHSGOVFRAUDCOMPLIANCEGUIDANCEHTML HTTPOIGHHSGOVFRAUDCOMPLIANCEGUIDANCEHTML2 OIG
- REMOTE HOME BLOOD PRESSURE MONITORING VINE HOUSE HEALTH CENTRE
- PÉNZKEZELÉSI SZABÁLYZAT MINTA TARTALOMJEGYZÉK 1 ÁLTALÁNOS SZABÁLYOK 5
- AT&T WIRELESS PROVISIONING & ROUTING GUIDELINES THE WIRELESS PROVISIONING
- EXPOSURE DRAFT INSERTS FOR TAX LAWS AMENDMENT (2012 MEASURES
- STOCKHOLM 20110303 PRESSMEDDELANDE KUNSKAP NYCKEL TILL SÄKERT UNDERHÅLL
- WARUNKI PRZYJMOWANIA UCZNIÓW DO SZKOŁY PODSTAWOWEJ NR 2 IM
- EU WELCOME PROJECT 2008 TY I TWÓJ SAMOCHÓD W
- PPEK 518 MALCOLM MUGGERIDGE VALAMI NAGYON SZÉPET ISTENÉRT MALCOLM
- THE TREATMENT OF INTRACTABLE PLANTAR FASCIITIS WITH PLATELETRICH PLASMA
- AUTOSHAPE 4 AKREDITASI PERPUSTAKAAN PERPUSTAKAAN NASIONAL RI PETUNJUK
- LEI Nº 5930 DE 25 DE MAIO DE 2010
- COLOQUIO NACIONAL DE FÍSICA TEÓRICA EN HOMENAJE A ELÍAS
- LA JURISPRUDENCIA DE LA CORTE INTERAMERICANA DE DERECHOS HUMANOS
- POSTA ZERBITZUA KONTRATATZEKO BALDINTZA TEKNIKOEN AGIRIA (X11032 ESPEDIENTEA) 1
- TERMO DE COMPROMISSO DE ESTÁGIO DE ESTUDANTE TERMO DE
- NAUJAMETINIAME BĖGIME VILNIUJENAUJAMETINIAME BĖGIME VILNIUJE X GAUTIEJI
- EKONOMSKI FAKULTET UNIVERZITETA U BEOGRADU PREDMET FINANSIJSKA TRŽIŠTA (60+30
- EMBAJADA DE AUSTRALIA LIMA – PERU CORPORATE SERVICES OFFICER
- OZNÁMENÍ O PLNĚNÍ POVINNÉ ŠKOLNÍ DOCHÁZKY V ZAHRANIČÍ ZÁKONNÝ
- CHARGÉE DÉTUDES OBSERVATOIRE NATIONAL DE LESS CNCRESS FICHE
- THIS DOCUMENT AND ANY ACCOMPANYING DOCUMENTS ARE IMPORTANT AND
- ANEXO I MODELO DE SOLICITUD MONITORES DE “ESCUELAS DEPORTIVAS”
- ERRATA TO BPA POWER PRODUCTS CATALOG SEPTEMBER 1999 PAGE
- 10TH INTERNATIONAL CONFERENCE ON TRIBOLOGY – BALKANTRIB ‘20 BELGRADE
- DRØMMESPOR FAG DANSK KLASSETRIN 36 KLASSE BESKRIVELSE SÆT
- 2 1132010 U SKLADU SA EVROPSKIM STANDARDOM EN 9981
- CHILD PRITE 2017 CONTENT OUTLINE A NEUROSCIENCES 1NEURODEVELOPMENT (FETUS
- КОНСПЕКТ СОВМЕСТНОЙ ОБРАЗОВАТЕЛЬНОЙ ДЕЯТЕЛЬНОСТИ С ДЕТЬМИ ПОДГОТОВИТЕЛЬНЫХХ ГРУПП ИГРА
RI I OŚ2710 162016 ZAŁ NR 7 WZÓR UMOWY
 ПРОГРАМ ПОСЛОВАЊА ЈКП „СТАРИ ГРАД“ ШАБАЦ ЗА 2016 ГОДИНУ
REQUISITOS ESPECÍFICOS POR TIPO DE INVERSIÓN INVERSIÓN EN BIENES
 BRADAČ D ŽIVLJENJSKI CIKEL IZDELKA SEM NAL EKONOMSKA ŠOLA
 GUÍA PARA LA ELABORACIÓN DE TRABAJOS EN GRUPO ÍNDICE
EBAA WORKERS COMPENSATION (SEE KFD) EBAA THE DISTRICT WILL
EUROPA PRESS 17 DE ENERO DE 2006 UN FUNCIONARIO
 MORAVSKOSLEZSKÝ BULLDOGMOPS KLUB POŘÁDÁ V SOBOTU 2 ŘÍJNA 2021
 LOCAL GOVERNMENT PENSION SCHEME (LGPS) INDIVIDUAL TRANSFERS TO AND
 APPENDIX 3 FREQUENTLY ASKED QUESTIONS – CHARITIES (REFERENCE
SEMMELWEIS EGYETEM HABILITÁCIÓS BIZOTTSÁGA TUDOMÁNYOS KOLLOKVIUM FORGATÓKÖNYVE I ZÁRT
IZVJEŠĆE SA GODIŠNJE SKUPŠTINE DOBROVOLJNOG VATROGASNOG DRUŠTVA PODBREST DANA
 SEMINARIS TÈCNICS DEL COL·LEGI RECOLLIDA DE DADES I RAONAMENT
NDA CONFERENCE ON CHILDHOOD & DISABILITY 22 NOVEMBER 2005
702011 NEFMI REND 552012(XII28) EMMI RENDELET 19211 NEUROPSZICHOLÓGIAI DIAGNOSZTIKA
 RESOLUCION NO ADOAF04098 SAN SALVADOR 27 DE MAYO DE
053B ADVANCED CONVERSATION QUIZ 1 MARCH 17 2006 NAME
 1 WWWFBBVAES 2 NOTA DE PRENSA 3 4 FRANCIS
 1 INTRODUCTION IN ACCORDANCE WITH THE DESSION 2CMP17 OF
 23 US DEPARTMENT OF HOUSING AND URBAN DEVELOPMENT OFFICE
