LESSON ELEMENT BIOLOGICAL PSYCHOLOGY CORE STUDY AREA
CLASSROOM TESTED LESSON VIDEO DESCRIPTION “SECRETS OF THELESSON PLAN FORMAT FOR ELEMENTARY MIDDLE SCHOOL METHODS
SCIENCE LESSON PLAN IONIC AND COVALENT BODING
Teach Engineering Stem Curriculum Lesson Designing Bridges
UNIT SLAVERY LESSON 25 FREDERICK DOUGLASS (2
013_Spring1_UKS2_Yr5_Lesson_5
AS and A Level Psychology Lesson Element Casey Procedure

Lesson Element
Biological Psychology Core Study
Area: Developmental Psychology
Key Theme – Regions of the brain Casey et al. (2011) Behavioural and neural correlates of delay of gratification 40 years later
Instructions and answers for teachers
These instructions and answers to suggested activities cover the student activity section which can be found on page 5. This Lesson element supports OCR AS and A Level Psychology.
When distributing the activity section to the students either as a printed copy or as a Word file you will need to remove the teacher instructions section.
Aim
The aim of this lesson element is to provide a structured activity that will enable learners to cover the specification requirements for the Casey et al. core study.
This activity offers an opportunity for English skills development.
This activity offers an opportunity for maths skills development.

Objectives
‘Tell the story’ of the core study in terms of:
Background.
Method
Design
Sample
Materials/apparatus
Procedure.
Results.
Conclusions.
Abstract
Casey examined areas of the brain involved in self-regulation (self-control to tempting or alluring stimuli) in a sample of adults who had performed the delay of gratification task 4 decades ago as pre-schoolers. Nearly 60 individuals, now in their mid-forties, were tested on “hot” (smiling face) and “cool” (fearful face) versions of a go/no-go task to assess whether delay of gratification in childhood determines the ability to control impulses as adults. Individuals who were less able to delay gratification in preschool and consistently showed low self-control abilities in their twenties and thirties (on self-report scales measuring levels of self-control) performed more poorly than did high delayers when having to suppress a response to a happy face but not to a neutral or fearful face. This finding suggests that sensitivity to environmental hot cues plays a significant role in individuals’ ability to suppress actions towards alluring stimuli. 26 of these participants underwent functional imaging (brain scanning) to see if there were differences (between high and low delayers of gratification) in brain activity in an area called frontostriatal circuitry when taking the task. One area (prefrontal cortex) was more active in high delayers than low delayers on no-go and go trails, whereas, the ventral striatum showed higher activity (recruitment) in low delayers. Casey concluded that, resistance to temptation as measured originally by the delay of gratification (cookie) task as a child, is a relatively stable (consistent) individual difference that predicts reliable biases in frontostriatal circuitries that integrate motivational and control processes.
T ask
ask
This is a challenging task and would be interesting to get
different students to read their answers out.
Research Methods Opportunity – What is the purpose of an abstract?
Using your notes, textbooks and/or OCR core study guide, complete the following tasks...
1. Background – Brain areas: Complete the table
The Ventral Striatum The Inferior Frontal Gyrus

Ventral Striatum
Note: (side view, eyes would be on the right in this image) Note: (side view, eyes would be on the left in this image)
|
The Ventral Striatum |
Brain Area |
The Inferior Frontal Gyrus |
|
“desires”, “emotions”, |
What function has the area been associated with? (include “desires”, “emotions”, “cognitive control” into appropriate areas). |
“cognitive control” |
|
Lack of delay of gratification. Impulsive behaviour |
Which behaviours could be associated with this area of the brain if it was ‘over-active’ in an individual. |
Highly controlled individual, Obama-style composure. |
|
Eat it now! Take what you can immediately! |
What would this area ‘demand’ when faced with the option of one cookie now or ten cookies later if you don’t touch the cookie. |
Do not eat it, wait and we shall get 10. |
|
Smile back! |
What would this area ‘demand’ when faced with someone smiling warmly at you but you were told try not to smile back. |
Don’t smile back |
2. Research Method
Not a true experiment, although it has an IV and a DV, the IV is
naturally occurring and is not manipulated by the experimenter.
Q. What is the definition of a quasi
experiment?
Q. Why can this study be considered a quasi experiment?
Whether they were classed as high or low delayers was decided at the
age of 4 in the original cookie experiments. There was no random
assignment to groups by the researchers.
3. Operationalise the IV and DV of this study
IV – High delayer - resisted the cookie at 4 years old and
scored very low on the self-control self reports in their 20’s
and 30’s.
IV – Low delayer – did not resist the cookie at 4 years
old and scored very low on the self-control self reports in their
20’s and 30’s.
IV
DV
Accuracy in terms of correct/incorrect responses on the go/no-go,
reaction times on this test and the fMRI activity readings.
4. Summarise the different tasks referred to in the study.
|
Task |
Description of Task |
Type of data produced |
|
Original Delay of Gratification Task (at 4 years old) |
One cookie now or two if you wait 10 minutes. |
quantitative |
|
Self-report in 20’s and 30’s |
Self-report containing scales. |
quantitative |
|
Go/No-go Task – “Cold task” |
Press a button (of key on keyboard) when a specified male or female face is shown. |
quantitative |
|
Go/no-go task – “Hot task” |
Press a button (of key on keyboard) when a specified happy or fearful face is shown. |
quantitative |
|
Which of the above were used in the fMRI scanner? |
Hot and Cold tasks were used in the scanner. |
quantitative |
5. Using words AND PICTURES draw a timeline from the background to the current study (1960 – 2011) including the following terms:


1960


6. Now add (using a different colour) details to represent how the sample changed over that time.
7. Draw the go/no-go tasks (for both hot and cold tasks) used in this research. Add the participant with a button to press.
H
 ot
tasks Cold
Tasks
ot
tasks Cold
Tasks
8. Draw a rough bar chart (as you do not have the raw data) to visually represent the different findings.
Outside the scanner
Reaction Times:
a) “Go tasks” (click when you see an X face (male, female, happy, fearful)
Finding:
|
There
were no effects of delay group on reaction
|
V
A ccuracy
on go and no-go trials:
ccuracy
on go and no-go trials:
Finding:
|
All participants performed with a high level of accuracy for correctly responding to “go” trials during both the “cool” (99.8% correct) and “hot” tasks (99.5% correct).
V
Accuracy for “no-go” trials was more variable, with low delayers committing more false alarms than high delayers.
|
V
A ccuracy
on cool vs. hot tasks
ccuracy
on cool vs. hot tasks
Finding:
|
Low and high delayers performed comparably on the “cool” task but the low delayers trended towards performing more poorly on the “hot” task than the high delayers
Visually represent this task in this box:
Only the low delay group showed a significant decrement in performance for the “hot” trials relative to the “cool” trials.
|
Visually represent this task in this box:
Experiment 2 - Inside the Scanner
Finding:
Reaction times (inside the scanner)
The two delay groups did not differ significantly in reaction times in correct “go” trials
|
(P ≥ 0.4).
|
Stats Question!
Q
The difference was only significant with a 40% chance of error
which is not close to the 5% psychologist work to as a minimum.
Accuracy on go and no/go trials inside the scanner:
Overall accuracy rates for the “hot” (emotions) go/no-go task were uniformly high for “go” trials (mean 98.2% correct hits) with more variable performance to “no-go” trials (12.4% false alarm rate).
Q. Why, as in experiment 1, are the “hot” go trials not producing significant differences between the high and low delay groups?
Because the low delayers have no problem with “go”
trials because their impulsivity benefits this task.
As in Experiment 1, low delayers committed more false alarms than high delayers (but not significantly).
Experiment 2 - fMRI imaging results
Finding 1
The right inferior frontal gyrus was involved in accurately withholding a response.
Compared with high delayers, low delayers had diminished recruitment of the inferior frontal gyrus for correct “no-go” relative to “go” trials.
Task: Visually represent the above finding. Use a brightly coloured pen to activate the frontal gyrus.
F.G. of Low Delayers on no/go tasks F.G. of High Delayers on no-go tasks
Finding 2
The ventral striatum demonstrated a significant difference in recruitment between high and low delayers.
This reward-related region of the brain showed elevated activity to happy “no-go” trials for low delayers relative to high delayers.
Task: Visually represent the above finding. Use a brightly coloured pen to activate the ventral striatum.
V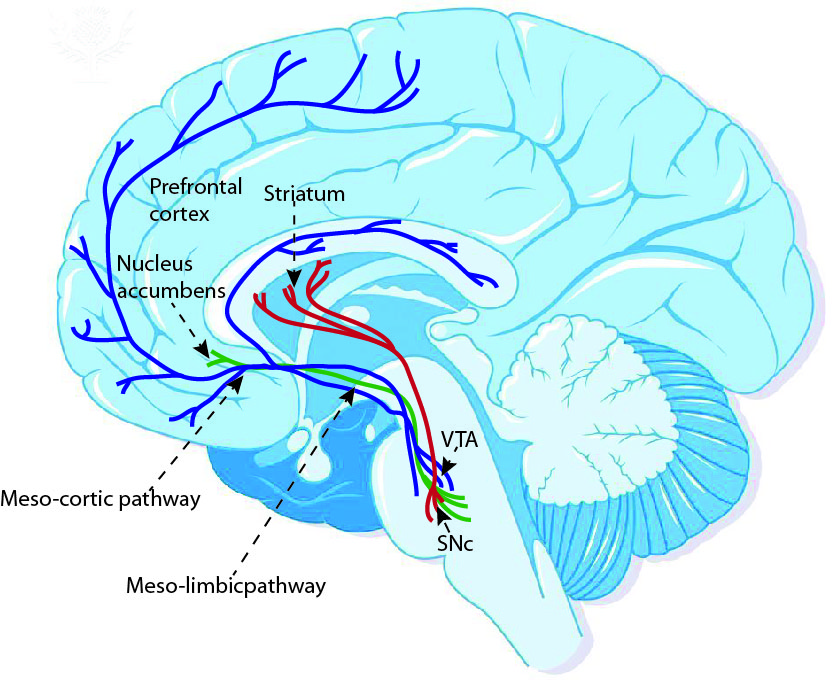 .S
of Low Delayers on ‘happy’ no-go trials V.S of High
Delayers on ‘happy’ no-go trials
.S
of Low Delayers on ‘happy’ no-go trials V.S of High
Delayers on ‘happy’ no-go trials
Summarise the Conclusions of the study using these questions
Q1. What does the study show about people’s individual differences to “hot” cues (or alluring stimuli)?
That there are individual differences that seem set from at least
the age of 4 which impact our reactions to alluring stimuli. High
delayers can resist these consistently whereas low delayers find it
difficult to resist these cues and not behaviourally react.
Q2. What does the fact that participants who performed poorly on the original delay of gratification task at the age of four also showed differences on the current study mean about the ability to delay gratification?
Original delay if gratification task is a relatively stable
individual difference that predicts biases in frontostriatal
circuitries that join motivational and
control processes.
Q3. What does the study show us about the effect that different levels of alluring stimuli can have in highlighting our individual differences?
Ability to resist temptation depends on context. The more tempting
the stimuli, the more obvious individual
differences are when they are trying to
suppress the temptation.
Q4. Overall, what does this study tell us about human individual differences in terms of our ability to resist temptation and delay gratification for future gain?
Individuals at 4 years old continue to show reduced self-control
abilities as adults in suppressing responses to positive social
cues.
We’d
like to know your view on the resources we produce. By clicking on
‘Like’
or ‘Dislike’
you can help us to ensure that our resources work for you. When the
email template pops up please add additional comments if you wish
and then just click ‘Send’. Thank you.
If you
do not currently offer this OCR qualification but would like to do
so, please complete the Expression of Interest Form which can be
found here: www.ocr.org.uk/expression-of-interest
Biological Psychology Core Study
Key Theme – Regions of the brain
Casey et al. (2011) Behavioural and neural correlates of delay of gratification 40 years later: Procedure
Abstract
Casey examined areas of the brain involved in self-regulation (self-control to tempting or alluring stimuli) in a sample of adults who had performed the delay of gratification task 4 decades ago as pre-schoolers. Nearly 60 individuals, now in their mid-forties, were tested on “hot” (smiling face) and “cool” (fearful face) versions of a go/no-go task to assess whether delay of gratification in childhood determines the ability to control impulses as adults. Individuals who were less able to delay gratification in preschool and consistently showed low self-control abilities in their twenties and thirties (on self-report scales measuring levels of self-control) performed more poorly than did high delayers when having to suppress a response to a happy face but not to a neutral or fearful face. This finding suggests that sensitivity to environmental hot cues plays a significant role in individuals’ ability to suppress actions towards alluring stimuli. 26 of these participants underwent functional imaging (brain scanning) to see if there were differences (between high and low delayers of gratification) in brain activity in an area called frontostriatal circuitry when taking the task. One area (prefrontal cortex) was more active in high delayers than low delayers on no-go and go trails, whereas, the ventral striatum showed higher activity (recruitment) in low delayers. Casey concluded that, resistance to temptation as measured originally by the delay of gratification (cookie) task as a child, is a relatively stable (consistent) individual difference that predicts reliable biases in frontostriatal circuitries that integrate motivational and control processes.
T
ask
Research Methods Opportunity – What is the purpose of an abstract?
Using your notes, textbooks and/or OCR core study guide, complete the following tasks...
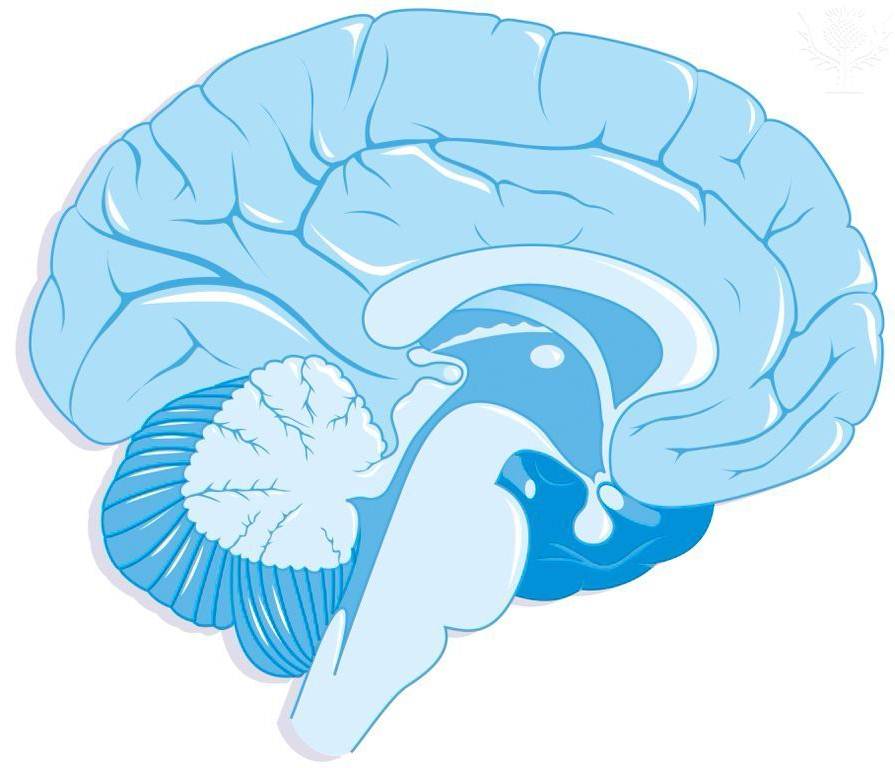
1. Background – Brain areas – Complete the table
The Ventral Striatum The Inferior Frontal Gyrus
Ventral Striatum
Note: (side view, eyes would be on the right in this image) Note: (side view, eyes would be on the left in this image)
|
The Ventral Striatum |
Brain Area |
The Inferior Frontal Gyrus |
|
|
What function has the area been associated with? (include “desires”, “emotions”, “cognitive control” into appropriate areas). |
|
|
|
Which behaviours could be associated with this area of the brain if it was ‘over-active’ in an individual. |
|
|
|
What would this area ‘demand’ when faced with the option of one cookie now or ten cookies later if you don’t touch the cookie. |
|
|
|
What would this area ‘demand’ when faced with someone smiling warmly at you but you were told try not to smile back. |
|
2. Research Method
Q. What is the definition of a quasi
experiment?
Q. Why can this study be considered a quasi experiment?
3. Operationalise the IV and DV of this study
IV
DV
4. Summarise the different tasks referred to in the study.
|
Task |
Description of Task |
Type of data produced |
|
Original Delay of Gratification Task (at four years old) |
|
|
|
Self-report in 20s and 30s |
|
|
|
Go/no-go task – “Cold task” |
|
|
|
Go/no-go task – “Hot task” |
|
|
|
Which of the above were used in the fMRI scanner? |
|
|
5. Using words AND PICTURES draw a timeline from the background to the current study (1960 – 2011) including the following terms:
1960
6. Now add (using a different colour) details to represent how the sample changed over that time.
7. Draw the go/no-go tasks (for both hot and cold tasks) used in this research. Add the participant with a button to press.
H ot
tasks Cold
Tasks
ot
tasks Cold
Tasks
8. Draw a rough bar chart (as you do not have the raw data) to visually represent the different findings.
Outside the scanner
Reaction Times:
a) “Go tasks” (click when you see an X face (male, female, happy, fearful)
Finding:
|
There
were no effects of delay group on reaction
|
V
A
ccuracy
on go and no/go trials
Finding:
|
All participants performed with a high level of accuracy for correctly responding to “go” trials during both the “cool” (99.8% correct) and “hot” tasks (99.5% correct).
V
Accuracy for “no-go” trials was more variable, with low delayers committing more false alarms than high delayers.
|
V
A
ccuracy
on cool vs. hot tasks
Finding:
|
Low and high delayers performed comparably on the “cool” task but the low delayers trended towards performing more poorly on the “hot” task than the high delayers
Visually represent this task in this box:
Only the low delay group showed a significant decrement in performance for the “hot” trials relative to the “cool” trials.
|
Visually represent this task in this box:
Experiment 2 - Inside the Scanner
Finding:
Reaction times (inside the scanner)
The two delay groups did not differ significantly in reaction times in correct “go” trials
|
(P ≥ 0.4).
|
Stats Question!
Q
Accuracy on go and no/go trials inside the scanner:
Overall accuracy rates for the “hot” (emotions) go/no-go task were uniformly high for “go” trials (mean 98.2% correct hits) with more variable performance to “no-go” trials (12.4% false alarm rate).
Q. Why, as in experiment 1, are the “hot” go trials not producing significant differences between the high and low delay groups?
As in Experiment 1, low delayers committed more false alarms than high delayers (but not significantly).
Experiment 2 - fMRI imaging results
Finding 1
The right inferior frontal gyrus was involved in accurately withholding a response.
Compared with high delayers, low delayers had diminished recruitment of the inferior frontal gyrus for correct “no-go” relative to “go” trials.
Task: Visually represent the above finding. Use a brightly coloured pen to activate the frontal gyrus.
F.G. of Low Delayers on no/go tasks F.G. of High Delayers on no/go tasks
Finding 2
The ventral striatum demonstrated a significant difference in recruitment between high and low delayers.
This reward-related region of the brain showed elevated activity to happy “no-go” trials for low delayers relative to high delayers.
Task: Visually represent the above finding. Use a brightly coloured pen to activate the ventral striatum.
V
.S
of Low Delayers on ‘happy’ no-go trials V.S of High
Delayers on ‘happy’ no-go trials
Summarise the Conclusions of the study using these questions
Q1. What does the study show about people’s individual differences to “hot” cues (or alluring stimuli)?
Q2. What does the fact mean that participants who performed poorly on the original delay of gratification task at the age of four also showed differences on the current study about the ability to delay gratification?
Q3. What does the study show us about the effect that different levels of alluring stimuli can have in highlighting our individual differences?
Q4. Overall, what does this study tell us about human individual differences in terms of our ability to resist temptation and delay gratification for future gain?
 January
2016
January
2016
1 EDTPA LESSON PLAN PROFESSIONAL GUIDELINES 72314 REVISED 8417
10 AMAZING LIFE LESSONS YOU CAN LEARN FROM ALBERT
10 MICRO I LESSON 3 PREFERENCES LESSON 2
Tags: biological psychology, element biological, lesson, biological, element, psychology, study
- LOS PRONOMBRES DE COMPLEMENTO DIRECTO E INDIRECTO A TRAVÉS
- SOCIOLOGIJA – LITERATURA ZA POLAGANJE ISPITA ALEKSANDER DŽ Č
- FDA MEDICAL DEVICE QUESTIONNAIRE QNET LLC PHONE 7634410899 PO
- 17TH CHEMISTRY OLYMPIAD OF THE BALTIC STATES RIGA LATVIA
- 2 UNFALLANZEIGE 1 NAME UND ANSCHRIFT DES
- PERSONNEL POLICY 2006 JULY 1 2008 (CONTINUED) PAGE 2
- 1 ENTER THE TIME SERIES IN AN EXCEL WORKSHEET
- OSLO 290307 DERESREF SPST BHA 052819 VÅR
- IEEE C80216MAINT07060 PROJECT IEEE 80216 BROADBAND WIRELESS ACCESS WORKING
- CONFIDENTIAL GUIDELINES OF APPLICATION FORM FOR THE JICA KNOWLEDGE
- OFFICIAL (COMMERCIAL) GRANT AGREEMENT THIS DEED IS DATED [DATE2016]
- C OMPRENSION LECTORA – CUARTO DE PRIMARIA LA CONQUISTA
- CFPA CARLES SALVADOR LA HUERTA Nº 10 – 03610
- 4 DIEGO ARIAS REGALÍA – CONTENIDOS CONCEPTUALES DE MATEMÁTICA
- OBRAZAC 1 ZAHTJEV ZA POTPORE NA TEMELJU UREDBE O
- Acta 24 2016 Reunion Ordinaria Junta Directiva 24
- UREDBA O ELEKTRONSKOM KANCELARIJSKOM POSLOVANJU ORGANA DRŽAVNE UPRAVE (SL
- ANEXO 1º CONVOCATORIA DE PLAZAS DEL GOBIERNO DE NAVARRA
- GUÍA DE ADMINISTRACIÓN DE MEDICAMENTOS VÍA PARENTERAL HOSPITAL UNIVERSITARIO
- Ðïࡱáþÿ ¥áq ¿bjbjt+t+ 0aaâgÿÿÿÿÿÿ]x92x92x92x92nnnbbbbb Nbt¶x8ex8ex8ex8e¶ggg9ô ¶ngë|gggx8bx92x92x8e¶x8ex8bx8bx8bgx92x86x8e(n¶9bbx92x92x92x92g9x8b®x8b96n9¶x82 Àã¨îdæbbc(9goulds Turkeys Making
- ACUERDO 052019 DEL FISCAL GENERAL DEL ESTADO DE MORELOS
- GUÍA DE FORMULACIÓN DE EMPRESAS RECTANGLE 18 GUÍA
- ALUMNOSAS MATRICULADOS EN 2º ESO PENDIENTE 1º PARA
- FUNDO MUNICIPAL DE SAÚDE PRAÇA KENNEDY SN CENTRO
- CELE I ZADANIA REALIZACYJNE POWIATOWEGO PROGRAMU ZATRUDNIENIA I AKTYWIZACJI
- CORPORATE INFORMATION SYSTEMS HTTPWWWSUSSEXACUKITSHELPBISHELPPHP OFFSITE CONTACTS SYSTEM ACCOUNT
- A DVENT – NADAL 2015 CONECTOR RECTO 1 INTRODUCCIÓ
- MAUKAH ENGKAU SEMBUH ? JUDUL MAUKAH ENGKAU SEMBUH?
- [PROGRAMIN ADI] TR XXXXXXXXXX NO’LU PROJESİ AVRUPA
- UNEPOZLPROWG124INF2 NACIONES UNIDAS EP UNEPOZLPROWG124INF2 PROGRAMA DE LAS
COMO SERVIR A DIOS MEJOR SI ESTOY COMPROMETIDO
 WTMIN(96)16 PÁGINA 18 ORGANIZACIÓN MUNDIAL WTMIN(96)16 13 DE DICIEMBRE
İLLERİMİZ AB BİRİMLERİ VE İLGİLİ WEB ADRESLERİ İLIN ADI
AL MARGEN UN SELLO QUE DICE SECRETARÍA GENERAL DE
 ZAŁĄCZNIK NR 5 DO SIWZ OPIS PRZEDMIOTU ZAMÓWIENIA CZĘŚĆ
AGREEMENT TO PARTICIPATE WITH A CONSUMER REPRESENTATIVE IN CONSUMER
 PRIJAVA ZA UPRAVIČENCE IN KANDIDATE KI ŽELIJO SODELOVATI V
 ANUNCI MITJANÇANT DECRET D’ALCALDIA NÚM 2020EJ20190000070 DE DATA 16
 VÝVOJ VÝROBY MASA A NÁKUPU MLÉKA VE 3 ČTVRTLETÍ
LAW ON TERRITORIAL ORGANIZATION OF THE LOCAL SELFGOVERNMENT IN
NÚMERO NOMBRE COMERCIAL PRINCIPIO ACTIVO CONCENTRACIÓN LABORATORIO RAZÓN DE
TRANSMITTED BY THE EXPERT FROM OICA INFORMAL DOCUMENT NO
SENIOR MANAGEMENT GROUP OUTSIDE PROFESSIONAL ACTIVITIES (OPA) DETAILED INFORMATION
REYNOLDS ELEMENTARY SCHOOL PARENT AND FAMILY ENGAGEMENT POLICY 20182019
 ESQUEMA A SEGUIR EN EL ESTUDIO Y REPRESENTACIÓN DE
PROCEDIMIENTO DE CALCULO DE EXTINTORES DETERMINACIÓN DE LA
DIRECTORATE OF SCHOOL EDUCATION GOVT OF MIZORAM TEACHERS PROFILE
 INSTRUCTIVO DE TRABAJO ANÁLISIS CÓDIGO IT003203 REVISIÓN 0 FECHA
STATE OF MARYLAND (OFFICE USE ONLY) MAIL APPLICATION TO
 LA RUTA DEL TER DOSSIER INFORMATIU LA RUTA
