SUPPLEMENTARY MATERIAL APPENDIX S3 CRISTESCU B STENHOUSE GB SYMBALUK
PRACTICE NOTE SOURCING SUPPLEMENTARY EMERGENCY RESPONSE RESOURCESSUPPLEMENTARY MATERIAL (ESI) FOR CHEMICAL COMMUNICATIONS THIS
(SUPPLEMENTARY ORDER PAPER) 19 DÁIL ÉIREANN DÉ MÁIRT 2
1 SUPPLEMENTARY MATERIAL FOR PERKIN TRANSACTIONS 1 THIS JOURNAL
1 SUPPLEMENTARY MATERIALS SUPPLEMENTARY TABLE 1 DESCRIPTION OF DES
1 SUPPLEMENTARY TABLE 1 CATEGORIZATION OF THE 120 NODULES
Supplementary material: Appendix S3
Cristescu, B., Stenhouse, G.B., Symbaluk, M., Nielsen, S.E. & Boyce, M.S. Wildlife habitat selection on landscapes with industrial disturbance.
Appendix S3 contains outputs of k-fold cross validation for top habitat selection models for all grizzly bear reproductive classes (male, solitary female, female with cubs), study phases (during mining, post mining) and scales of availability (home-range level, study area-level).
Table 1 Appendix S3. Proportion of the true composition of male grizzly bear habitat selection states (1/0) predicted by top models during and after mining, with availability drawn at the home range and study area levels.
|
|
|
K-fold cross-validation |
||||
|
Male |
Selection |
Partition 1 |
Partition 2 |
Partition 3 |
Mean |
SE |
|
Home range - During |
||||||
|
G008 |
1 |
0.07 |
|
|
0.07 |
NA |
|
|
0 |
0.95 |
|
|
0.95 |
NA |
|
G029 |
1 |
0.12 |
|
|
0.12 |
NA |
|
|
0 |
0.81 |
|
|
0.81 |
NA |
|
Home range - After |
||||||
|
G112 |
1 |
0.98 |
|
|
0.98 |
NA |
|
|
0 |
0.20 |
|
|
0.20 |
NA |
|
G115 |
1 |
0.46 |
|
|
0.46 |
NA |
|
|
0 |
0.67 |
|
|
0.67 |
NA |
|
Study area - During |
||||||
|
G008 |
1 |
0.00 |
|
|
0.00 |
NA |
|
|
0 |
1.00 |
|
|
1.00 |
NA |
|
G029 |
1 |
0.24 |
|
|
0.24 |
NA |
|
|
0 |
0.74 |
|
|
0.74 |
NA |
|
Study area - After |
||||||
|
G112 |
1 |
0.91 |
|
|
0.91 |
NA |
|
|
0 |
0.26 |
|
|
0.26 |
NA |
|
G115 |
1 |
0.43 |
|
|
0.43 |
NA |
|
|
0 |
0.72 |
|
|
0.72 |
NA |
Data were partitioned without replacement per individual male bear. Estimates trained on individual(s) (fold[s]) were tested on a withheld individual. The number of folds was dictated by sample size (k = 1 for males). A mean cross-validation value of 1.00 indicates perfect predictive accuracy.
Table 2 Appendix S3. Proportion of the true composition of solitary female grizzly bear habitat selection states (1/0) predicted by top models during and after mining, with availability drawn at the home range and study area levels.
|
|
|
K-fold cross-validation |
||||
|
Female |
Selection |
Partition 1 |
Partition 2 |
Partition 3 |
Mean |
SE |
|
Home range - During |
||||||
|
G020 |
1 |
0.87 |
1.00 |
|
0.94 |
0.07 |
|
|
0 |
0.32 |
0.02 |
|
0.17 |
0.15 |
|
G040 |
1 |
0.00 |
1.00 |
|
0.50 |
0.50 |
|
|
0 |
1.00 |
0.02 |
|
0.51 |
0.49 |
|
G100 |
1 |
0.86 |
1.00 |
|
0.93 |
0.07 |
|
|
0 |
0.06 |
0.06 |
|
0.06 |
0.00 |
|
Home range - After |
|
|
|
|
|
|
|
G023 |
1 |
0.08 |
0.23 |
0.97 |
0.43 |
0.28 |
|
|
0 |
0.97 |
0.88 |
0.11 |
0.65 |
0.27 |
|
G111 |
1 |
0.33 |
0.03 |
0.80 |
0.39 |
0.22 |
|
|
0 |
0.72 |
0.97 |
0.19 |
0.63 |
0.23 |
|
G113 |
1 |
0.18 |
0.08 |
0.88 |
0.38 |
0.25 |
|
|
0 |
0.94 |
0.97 |
0.12 |
0.68 |
0.28 |
|
G118 |
1 |
0.36 |
0.26 |
0.13 |
0.25 |
0.07 |
|
|
0 |
0.85 |
0.87 |
0.88 |
0.87 |
0.01 |
|
Study area - During |
|
|
|
|
|
|
|
G020 |
1 |
0.85 |
0.79 |
|
0.82 |
0.03 |
|
|
0 |
0.30 |
0.39 |
|
0.35 |
0.05 |
|
G040 |
1 |
0.00 |
1.00 |
|
0.50 |
0.50 |
|
|
0 |
1.00 |
0.02 |
|
0.51 |
0.49 |
|
G100 |
1 |
0.00 |
0.77 |
|
0.39 |
0.39 |
|
|
0 |
1.00 |
0.55 |
|
0.78 |
0.23 |
|
Study area - After |
|
|
|
|
|
|
|
G023 |
1 |
0.90 |
0.47 |
1.00 |
0.79 |
0.16 |
|
|
0 |
0.40 |
0.87 |
0.05 |
0.44 |
0.24 |
|
G111 |
1 |
0.29 |
0.26 |
1.00 |
0.52 |
0.24 |
|
|
0 |
0.82 |
0.87 |
0.05 |
0.58 |
0.27 |
|
G113 |
1 |
0.67 |
0.93 |
1.00 |
0.87 |
0.10 |
|
|
0 |
0.82 |
0.40 |
0.05 |
0.42 |
0.22 |
|
G118 |
1 |
0.07 |
0.23 |
0.04 |
0.11 |
0.06 |
|
|
0 |
0.82 |
0.40 |
0.87 |
0.70 |
0.15 |
Data were partitioned without replacement per individual female bear. Estimates trained on individual(s) (fold[s]) were tested on a withheld individual. The number of folds was dictated by sample size (k = 2-3 for females). A mean cross-validation value of 1.00 indicates perfect predictive accuracy.
Table 3 Appendix S3. Proportion of the true composition of female grizzly bear with cubs habitat selection states (1/0) predicted by top models during and after mining, with availability drawn at the home range and study area levels.
|
|
|
K-fold cross-validation |
||||
|
Female cubs |
Selection |
Partition 1 |
Partition 2 |
Partition 3 |
Mean |
SE |
|
Home range - During |
||||||
|
G023 |
1 |
0.00 |
|
|
0.00 |
NA |
|
|
0 |
1.00 |
|
|
1.00 |
NA |
|
G040 |
1 |
0.93 |
|
|
0.93 |
NA |
|
|
0 |
0.13 |
|
|
0.13 |
NA |
|
Home range - After |
|
|
|
|
|
|
|
G023 |
1 |
0.78 |
0.52 |
|
0.65 |
0.13 |
|
|
0 |
0.20 |
0.57 |
|
0.39 |
0.19 |
|
G037 |
1 |
0.11 |
0.11 |
|
0.11 |
0.00 |
|
|
0 |
0.98 |
0.98 |
|
0.98 |
0.00 |
|
G040 |
1 |
0.87 |
0.65 |
|
0.76 |
0.11 |
|
|
0 |
0.18 |
0.59 |
|
0.39 |
0.21 |
|
Study area - During |
|
|
|
|
|
|
|
G023 |
1 |
0.01 |
|
|
0.01 |
NA |
|
|
0 |
1.00 |
|
|
1.00 |
NA |
|
G040 |
1 |
0.96 |
|
|
0.96 |
NA |
|
|
0 |
0.23 |
|
|
0.23 |
NA |
|
Study area - After |
|
|
|
|
|
|
|
G023 |
1 |
0.82 |
0.64 |
|
0.73 |
0.09 |
|
|
0 |
0.15 |
0.58 |
|
0.37 |
0.22 |
|
G037 |
1 |
0.18 |
0.60 |
|
0.39 |
0.21 |
|
|
0 |
0.68 |
0.58 |
|
0.63 |
0.05 |
|
G040 |
1 |
0.94 |
0.53 |
|
0.74 |
0.21 |
|
|
0 |
0.17 |
0.76 |
|
0.47 |
0.30 |
Data were partitioned without replacement per individual female bear accompanied by cubs. Estimates trained on individual(s) (fold[s]) were tested on a withheld individual. The number of folds was dictated by sample size (k = 1-2 for females with cubs). A mean cross-validation value of 1.00 indicates perfect predictive accuracy.
10 SUPPLEMENTARY DATA FOR “THE VACUUM UV PHOTOABSORPTION SPECTROSCOPY
11 Supplementary Record Form Advanced Livestock Record Rabbits 20to
12 SUPPLEMENTARY MATERIALS THIS FILE CONTAINS THREE SUPPLEMENTARY TABLES
Tags: appendix s3, 3 appendix, supplementary, material, appendix, cristescu, stenhouse, symbaluk
- MÉTODOS EN INVESTIGACIÓN PESQUERA EJERCICIOS CRECIMIENTO ANÁLISIS DE FRECUENCIAS
- ESTADÍSTICA I – PRÁCTICA 1 POWERPLUSWATERMARKOBJECT3 PRÁCTICA 2 ESTADÍSTICA
- MODELO DE CERTIFICACIÓN DEL ACTA DE REVOCACIÓN Y OTORGAMIENTO
- 4 TD 5482512 OPINIÓN Nº 0082015DTN ENTIDAD SUPERINTENDENCIA NACIONAL
- Jueves 16 de Diciembre de 2021 Diario Oficial 26
- PRESSEMELDING PROCOL HARUM SPILLER I KRISTIANSAND 26 MAI
- O 2 COVID19 (ÉTAPE TRANSITOIRE 1 EMPLOYÉS VULNÉRABLES RO
- KLUBA BULTENO ORGANO DE KLUBO ESPERANTISTA EN OSLO NRO
- 17 Neutrality and Political Liberalism Richard j Arneson for
- SCIENCE CEREAL BOX PROJECT DUE DATE NOVEMBER 10
- STSGB20123 SECRETARYGENERAL’S BULLETIN INTERNATIONAL CRIMINAL TRIBUNALS INFORMATION SENSITIVITY CLASSIFICATION
- Ðïࡱáþÿ ¥á[x80 п¹bjbj¬ú¬ú 4îx90îx90¹ÿÿÿÿÿÿ·gggggÿÿÿÿ[[[[o [µ¬{{{{{zzz4666666a¢!8zgzzzzzzgg{{ÿozx8eg{g{4z4r²{ÿÿÿÿ0kö±ô[x9e x850µ¨ !!²²!!zzzzzzzzz
- ПРИЛОЖЕНИЕ 4 ПРИМАРУ (МУНИЦИПИЙГОРОДКОММУНАСЕЛО) (ФАМИЛИЯ ИМЯ) РАЗРЕШЕНИЕ
- CONTRACT NUMBER START DATE AND END DATE OF THE
- BITTE STREICHEN SIE DIE BUCHSTABEN AN DIE IM ALPHABET
- URZĄD MIASTA TARNOWA WYDZIAŁ MIESZKALNICTWA TARNÓW DNIA IMIĘ I
- A SOCIACIÓN SOLIDARISTA DE EMPLEADOS DE ROBLEALTO ASEROBLE REGLAMENTO
- INFORME JUEZ JEFE DE FOTO FINISH LA COMPETICIÓN COMPETICIÓN
- HACIA UN PACTO DE ESTADO POR LA INFANCIA EN
- F FORM 1A (UNSUR MASYARAKAT) ORMULIR PENDAFTARAN CALON ANGGOTA
- EL PROYECTO PODRÁ RETIRARSE EN LA COPISTERÍA KOPYBASA (C
- T WHAT IS THE WORK NUMBER? HE WORK NUMBER®
- CRIB SHEET FOR THE PRACTICE MEETING BEFORE THE
- IMPRESSION ANALYSIS TEST REVIEW 1 WHAT IS THE MOST
- PLANT 194 – AGRICULTURAL INTERNSHIP PROGRAM OVERVIEW PREREQUISITE JUNIOR
- INFORME SOBRE AS PREVISIÓNS METEOROLÓXICAS PARA O DOMINGO 30
- CONCLUSIÓN SOBRE LA REFORMA DEL ESTATUTO ORGANICO DEL MINISTERIO
- UCHWAŁA NR XXX2992005 RADY GMINY W ZALESZANACH Z DNIA
- CUADRO TARIFARIO VIGENTE DESDE EL 1º AL 31072013 TARIFA
- CONTRADICCIÓN DE TESIS 2492016 CONTRADICCIÓN DE TESIS 2492016 ENTRE
RECOMMENDED QUALIFICATIONS FOR SHOP FOREMAN MECHANIC & BUS DRIVER
 THIS IS 230W BEAM MOVING HEAD LIGHT USER MANUAL
KATHRYN MORRIS SIR EARLE PAGE’S POLITICAL CAREER SIR EARLE
ROMÂNIA JUDEŢUL TIMIŞ CONSILIUL LOCAL AL ORAŞULUI RECAŞ CALEA
TRABAJO PRACTICO Nº IDENTIDAD CULTURA Y NACIONALIDAD LA
 INFORME DE AUDITORIA INTERNA AUDITORIA NO 04 FECHA DE
 Seminarski rad iz Predmeta Operativni Sistemi i Računarske Mreže
 C 23 DE JUNIO DE 2008 AUDI BRAKING GUARD
Ðïࡱáþÿ ¥á{à ø¿ )bjbjzäzä 0x8ex8e Fÿÿÿÿÿÿ· Hhhhhÿÿÿÿ|||8´4è|x98ôæê(òòòáó Ÿïññññññx8c²øõ]x97[òÿÿÿÿ ]x9erðÿÿÿÿmj×
15 IN THE HIGH COURT OF JUDICATURE KERALA [SPECIAL
 Reglamento-Consejo
 MEARNS PRIMARY SCHOOL MAY 2013 NEWSLETTER DEAR PARENTCARER AS
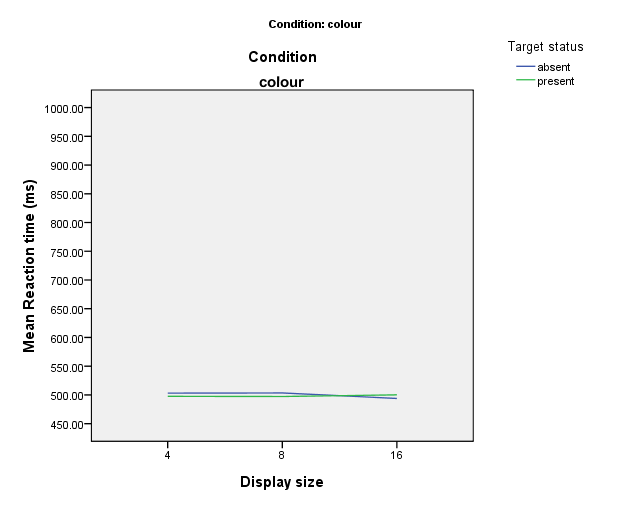 REACTION TIME DIFFERENCES IN SINGLE FEATURE SEARCH AND CONJUNCTION
- 2020_PROGRAM_GRADNJE
PROJECT INFORMATION DOCUMENT (PID) APPRAISAL STAGE REPORT NO AB1507
 19 REPUBLICA DE CHILE MINISTERIO DE SALUD DPTO ASESORIA
ACTING AS AN EXPERT WITNESS THERE ARE ITIC MEMBERS
 ZEHAZKI SOCIEDAD DE VALORACIONES C JAVIER DE BARKAIZTEGI 19
N A C R T NA TEMELJU ČLANKA 137
 AFIC ASOCIACIÓN FOTOGRÁFICA DE ISLA CRISTINA SÉPTIMO CONCURSO DE
