LAB HR DIAGRAM PURPOSE IN THIS LAB WE WILL
26 POLÍMEROS SINTÉTICOS POLÍMEROS SINTÉTICOS DIAGRAMAS TENSIÓNELONGACIÓN PLÁSTICOS VINÍLICOS34 BAB V ENTITY RELATIONSHIP DIAGRAM ( ERD )
6 APUNTE DE COMPILADORES DIAGRAMAS DE TRANSICIONES UNIVERSIDAD DE
6 COMPOSITIONAL PHASE DIAGRAMS USES OF COMPOSITIONAL PHASE DIAGRAMS
8 21 SISTEMA NEURONAL DIAGRAMA BÁSICO DE UNA NEURONA
9 DIAGRAMAS DE FASE EN LA PRESENTE PRÁCTICA SE
H-R Diagram Lab
Lab: H-R Diagram
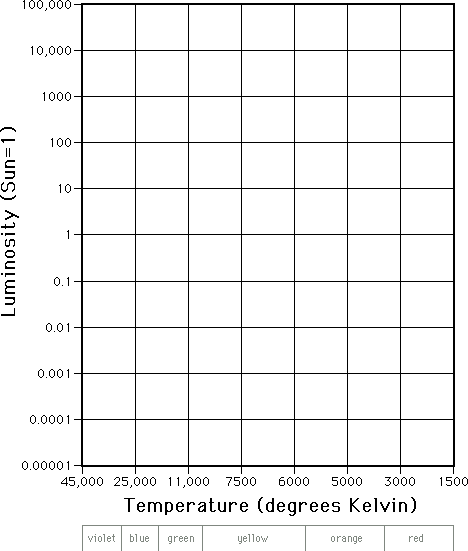
Purpose: In this lab we will investigate the relationship between the temperature, brightness and diameter of stars.
Introduction
The H-R Diagram is a tool that astronomers use to classify stars based on their luminosity, magnitude, temperature, spectral class and evolutionary stage. The H-R Diagram was independently discovered in the early 1900’s by the Danish astronomer Ejnar Hertzsprung and the American astronomer Henry Norris Russell. In this activity you will construct an HR Diagram.
Materials: Pencil, graph paper
Procedure
Cut out the graph and secure it into your notebook.
Plot the stars from Group 1 onto the graph.
Once you have plotted the stars from Group 1, answer the Group 1 Questions in your notebook.
Using the same graph, plot the stars from Group 2.
Once you have plotted the stars from Group 2, answer Group 2 Questions in your notebook.
Using the same graph, plot the stars from Group 3.
Once you have plotted the stars from Group 3, answer the Group 3 Questions in your notebook.
Refer to your textbook to label the following regions of your diagram- Main Sequence, Red Giants, White Dwarfs.
Using the key at the bottom of the graph, color code your diagram.
Answer the Additional Questions in your notebook.
Questions:
Group 1
What would you tell someone who thinks that all stars are very similar (be sure to discuss temperature and brightness)?
How does our sun compare to other stars in brightness and temperature?
Are the stars scattered randomly on the graph, or is there a pattern? Explain.
Would you expect hotter stars to be dim or bright? Does the graph agree with this answer?
Group 2
Do the Group 2 stars follow the same pattern as the Group 1 stars that you plotted? Explain.
Overall, are the stars in Group 2 very bright or very dim?
Are these stars hot or cool compared to other stars?
Is the relationship of brightness to temperature for these stars puzzling, or does it make sense? Explain.
Group 3
Compare the areas of the graph where the Group 2 and Group 3 stars are plotted. How are they different?
Overall, are the stars in Group 3 very bright or very dim?
Are these stars hot or cool compared to other stars?
Is the relationship of brightness to temperature for these stars puzzling, or does it make sense? Explain.
Additional Questions
As you can see from the Group 1 stars, the cooler or hotter a star is, the brighter it will be. The Group 2 and Group 3 stars do not follow this pattern. Hence, there must be something besides temperature that can affect how bright a star is. Describe your own theory about these stars (Group 2 and Group 3). Why would their brightness not be strictly related to their temperature?
What is the "Main Sequence?"
What percent of all stars are on the Main Sequence?
Explain the process of Nuclear Fusion.
Why is the process of nuclear fusion important in stars?
Why aren’t the Group 2 and Group 3 stars on the Main Sequence?

CLASS COPY
|
|
Group 1 |
Apparent Magnitude |
Distance |
Temperature |
Luminosity |
|
|
Sun |
-26.7 |
0.00002 |
5,800 |
1.00 |
|
|
Alpha Centauri A |
-0.01 |
4.3 |
5,800 |
1.5 |
|
|
Alpha Centauri B |
+1.4 |
4.3 |
4,200 |
0.33 |
|
|
Alpha Centauri C |
+11.0 |
4.3 |
2,800 |
0.0001 |
|
|
Wolf 359 |
+13.66 |
7.7 |
2,700 |
0.00003 |
|
|
Lalande 21185 |
+7.47 |
8.1 |
3,200 |
0.0055 |
|
|
Sirius A |
-1.43 |
8.7 |
10,400 |
23.0 |
|
|
Luyten 726-8 A |
+12.5 |
8.7 |
2,700 |
0.00006 |
|
|
Luyten 726-8 B |
+12.9 |
8.7 |
2,700 |
0.00002 |
|
|
Ross 154 |
+10.6 |
9.6 |
2,800 |
0.00041 |
|
|
Ross 248 |
+12.24 |
10.3 |
2,700 |
0.00011 |
|
|
Epsilon Eridani |
+3.73 |
10.8 |
4,500 |
0.30 |
|
|
Ross 128 |
+11.13 |
11.0 |
2,800 |
0.00054 |
|
|
61 Cygni A |
+5.19 |
11.1 |
4,200 |
0.084 |
|
|
61 Cygni B |
+6.02 |
11.1 |
3,900 |
0.039 |
|
|
Procyon A |
+0.38 |
11.3 |
6,500 |
7.3 |
|
|
Epsilon Indi |
+4.73 |
11.4 |
4,200 |
0.14 |
|
|
Vega |
+0.04 |
26.0 |
10,700 |
55.0 |
|
|
Achernar |
+0.51 |
65.0 |
14,000 |
200.0 |
|
|
Beta Centauri |
+0.63 |
300.0 |
21,000 |
5,000.0 |
|
|
Altair |
+0.77 |
16.5 |
8,000 |
11.0 |
|
|
Spica |
+0.91 |
260.0 |
21,000 |
2,800.0 |
|
|
70 Ophiuchi A |
+4.3 |
17 |
5,100 |
0.6 |
|
|
Delta Aquarii A |
+3.28 |
84 |
9,400 |
24.00 |
|
|
Delta Persei |
+3.03 |
590 |
17,000 |
1,300.0 |
|
|
Zeta Persei A |
+2.83 |
465 |
24,000 |
16,000.0 |
|
|
Tau Scorpii |
+2.82 |
233 |
25,000 |
2,500.0 |
|
|
Barnard's Star |
+9.54 |
6.0 |
2,800 |
0.00045 |
|
|
Luyten 789-6 |
+12.58 |
11.0 |
2,700 |
0.00009 |
|
|
Alpha Crucis |
+1.39 |
400.0 |
21,000 |
4,000.0 |
|
|
Fomalhaut |
+1.19 |
23.0 |
9,500 |
14.0 |
|
|
Deneb |
+1.26 |
1,400.0 |
9,900 |
60,000.0 |
|
|
Group 2 |
Apparent Magnitude |
Distance |
Temperature |
Luminosity |
|
|
Arcturus |
-0.06 |
36.0 |
4,500 |
110.0 |
|
|
Betelgeuse |
+0.41 |
500.0 |
3,200 |
17,000.0 |
|
|
Aldebaran |
+0.86 |
53.0 |
4,200 |
100.0 |
|
|
Antares |
+0.92 |
400.0 |
3,400 |
5,000.0 |
|
|
Group 3 |
Apparent Magnitude |
Distance |
Temperature |
Luminosity |
|
|
Sirius B |
+8.5 |
8.7 |
10,700 |
0.0024 |
|
|
Procyon B |
+10.7 |
11.3 |
7,400 |
0.00055 |
|
|
Grw +70 8247 |
+13.19 |
49 |
9,800 |
0.0013 |
|
|
L 879-14 |
+14.10 |
63? |
6,300 |
0.00068 |
|
|
Van Maanen's Star |
+12.36 |
14 |
7,500 |
0.00016 |
|
|
W 219 |
+15.20 |
46 |
7,400 |
0.00021 |
Credit: Activity adapted from sir-ray.com
A DIAGRAMMATIC APPROACH TO PEIRCE’S CLASSIFICATIONS OF SIGNS1 PRISCILA
A PCK FELÉPÍTÉSÉNEK LOGIKAI ÁBRÁJA (BLOKKDIAGRAM) NÉHÁNY PÉLDA AZ
A RESOLVER LA SUMA DE DOS NÚMEROS DIAGRAMA ENTRADA
Tags: diagram purpose:, h-r diagram, diagram, purpose
- CONTRATO DE ENSAYOS CLÍNICOS BARCELONA A DE 200 R
- IN THE ATTENTION OF THE DEAN OF THE FACULTY
- FECHA BANCO PIANO SA CUIT 30569151763 DOMICILIO
- EUGEN TASO ASSIGNMENT 6 1 THE GOAL OF YOUR
- SECTION 8 GMEC POLICY DATE FEBRUARY 2008 812
- UNITED NATIONS NATIONS UNIES FRAMEWORK CONVENTION ON CLIMATE CHANGE
- “2015” BOB VIGARS SEASON’S OPENER 40TH ANNUAL SATURDAY NOVEMBER
- VERSLAG TRANSMÁXDAG GRENZELOZE ZORG EEN ILLUSIE OF EEN WENKEND
- p Oradnia nr 7 w Lublinie 20027 Lublin
- TEACHER TOTAL PAGES FOR STUDENT THIS NINE WEEKS
- Appendix No 6 to Rector’s Order No 672016 Dated
- II NÁVRH NAŘÍZENÍ VLÁDY ZE DNE 2019 KTERÝM SE
- TC AYDIN BÜYÜKŞEHİR BELEDİYESİ ÇEVRE KORUMA DAİRESİ BAŞKANLIĞI (ATIK
- DESAFÍOS DE LA MUJER MIGRANTE EN LOS PAÍSES DE
- PROGRAM HÖSTEN 2019 STUDIECIRKLAR SOM GER TRIVSAM SAMVARO
- NOTA DE PRENSA LA FUNDACIÓN MERCK SALUD PUBLICA UN
- SENIOR CHARGE NURSE JOB DESCRIPTION 1 JOB DETAILS JOB
- SOPIK PELAYANAN SEMINAR HASIL TESIS DAN DISERTASI PROGRAM PASCASARJANA
- TESİSAT EĞİTİM SETİ TEKNİK ŞARTNAMESİ 1 EĞITIM SETI
- TAULA DE DIÀLEG PER A LA PREVENCIÓ DELS
- PEŠPOT TRBONJE 341 T E H N I Č
- 20 JAHRE HUG HUG – WINTERSEMESTER 20092010 DI 17
- ANEXO II FICHAS DE GASTO F 1 INVERSIONES EN
- JANUARI 2019 YTH MENTERI PARIWISATA DI – JAKARTA
- BREAKING THE RULES IN INTERACTIVE MEDIA DESIGN EDUCATION DR
- UNIVERSIDAD COOPERATIVA DE COLOMBIA FACULTAD DE MEDICINA SEDE MEDELLÍN
- C4611 PÁGINA 3 S C4611 ORIGINAL INGLÉS FECHA 1
- REISEBERICHT BITUON BEACH RESSORT PHILIPPINEN HERBST 2004 NACH LANGEN
- HUMAN RESOURCE FINANCE INFORMATION SYSTEMS WEB TIME ENTRY
- S221 ~ TRES TESOROS EXPRÉS DESDE PRAGA 13 DÍAS
 UPUTE ZA KORIŠTENJE FISKALPRO FISKALNE BLAGAJNE U OBLAKU
ZAŁĄCZNIK NR 6 ZAKRES USŁUGI UTRZYMANIA CZYSTOŚCI I
L2067 BONIFICACION POR DEDICACION EXCLUSIVA PAGENTES DE SALUD
DANE POTRZEBNE DO ZAŁOŻENIA STRONY INTERNETOWEJ KOŁA NA PORTALU
3 ARGUMENTACIÓN MUNDO DE LA VIDA Y FORMACIÓN GRUPO
ORIENTACIONES METODOLÓGICAS PARA EL DESARROLLO DEL PENSAMIENTO LÓGICOMATEMÁTICO
PARECE HAMSTER MAS NÃO É GISELE SIMÕES REPÓRTER O
KSÜ MÜHENDİSLİK VE MİMARLIK FAKÜLTESİ 20192020 EĞİTİMÖĞRETİM YILI İNŞAAT
 FORMATO TRÁMITE ANTICIPADO EPROSPECTUS BONOS SUBORDINADOS PROSPECTO
TÁJÉKOZTATÁS AZ ENGEDÉLY NÉLKÜL FÚRT VAGY ÁSOTT KUTAK ENGEDÉLYEZTETÉSÉRŐL
 NOTICE TO ANNUAL GENERAL MEETING IN HIQ INTERNATIONAL AB
ZAŁĄCZNIK NR 13 (UMOWA UŻYTKOWANIA DLA OSOBY FIZYCZNEJ) UMOWA
 UNCLASSIFIED PAROLE BOARD & PRISON SERVICE ORAL HEARING STANDARDS
 LEO KOJI JE KASNIJE PROCVAO LEO NIJE MOGAO
 URZĄD MIASTA RYBNIKA NUMER PROCEDURY OR014210 WERSJA 19 PROCEDURA
 SERVICE USER INFORMATION – AUTISM DIAGNOSTIC PATHWAY FREQUENTLY
 DRAMA COMMUNITY COHESION AND THE PREVENTION OF VIOLENT EXTREMISM
3 7 PASSIONSANDACHT NACH PALMARUM (28 MÄRZ) MIT GRÜNDONNERSTAG
 ESBORRANY ACTA CONSELL GENERAL 221116 OAM CENTRE CULTURAL SANT
 FRAGMENT KSIĄŻKI ANDRZEJA KALETY „STRATEGIA KONKURENCJI W PRZEMYŚLE” ROZDZIAŁ
