BROADBAND SOURCE INVERSION USING DIGITAL DATA FROM KOREAN SEISMIC
200903XX IEEE C80216ITU09XXXX PROJECT IEEE 80216 BROADBAND WIRELESS ACCESSA MODEL OF FAN BROADBAND NOISE DUE TO ROTORSTATOR
A NATION ONLINE ENTERING THE BROADBAND AGE SEPTEMBER 2004
BROADBAND CONNECTION VOUCHER SCHEME APPLICATION FORM THIS APPLICATION FORM
BROADBAND POLYGONAL INVISIBILITY CLOAK FOR VISIBLE LIGHT HONGSHENG CHEN12
BROADBAND SOURCE INVERSION USING DIGITAL DATA FROM KOREAN SEISMIC
Broadband Source Inversion Using Digital Data from Korean Seismic Networks
R. B. Herrmann1, Y.-S. Jeon1 and H.-J. Yoo2
1Department of Earth and Atmospheric Sciences, Saint Louis University, St. Louis, MO USA
2School of Earth and Environmental Sciences, Seoul National University, Seoul, ROK
Abstract
Broadband waveforms for the Korean digital seismic networks are used to invert for moment tensor solutions for the larger earthquakes in the 2000-2005 time period. The successful inversion required the determination of a crustal model for the Green's functions that can fit the waveforms in the 0.05 – 0.2 frequency band observed for the earthquakes. Such high frequencies require a well defined upper crust velocity model which is obtained from a joint inversion of receiver functions and surface-wave dispersion data. The surface-wave dispersion data consist of newly determined phase velocities in the 10 – 150 period range and group velocities in the 1 – 10 second period range. The focal mechanism solutions indicate a remarkably uniform pattern of the maximum compressive stresses that indicates a relation between earthquakes in Korea and the stresses set up by plate collisions.
Introduction
Compared to many other continental regions, the level of earthquake activity in Korea is not high. However investigation of the long historic record shows many instances of damaging earthquakes on the Korean peninsula (Lee et al, 2003; Chiu and Kim, 2004). Because of the effect of even moderate earthquakes on an industrial society, Korea installed a network of modern digital seismographs that have been providing data since 2000. These instruments are operated by the Korean Meteorological Administration (KMA) and the Korean Institute of Geoscience and Mineral Resources (KIGAM). In addition there are other instruments installed by other organizations. Current instrumentation consists of broadband velocity, short-period velocity and accelerometer sensors with 24-bit data acquisition and continuous telemetry to recording centers.
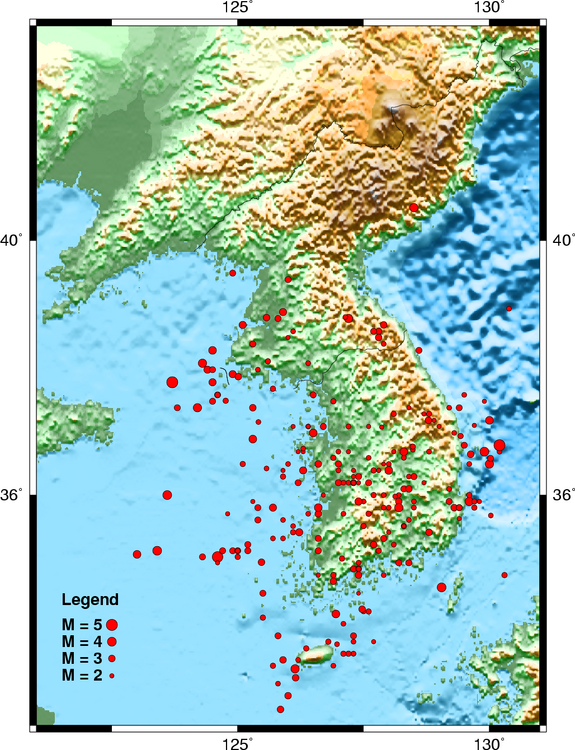
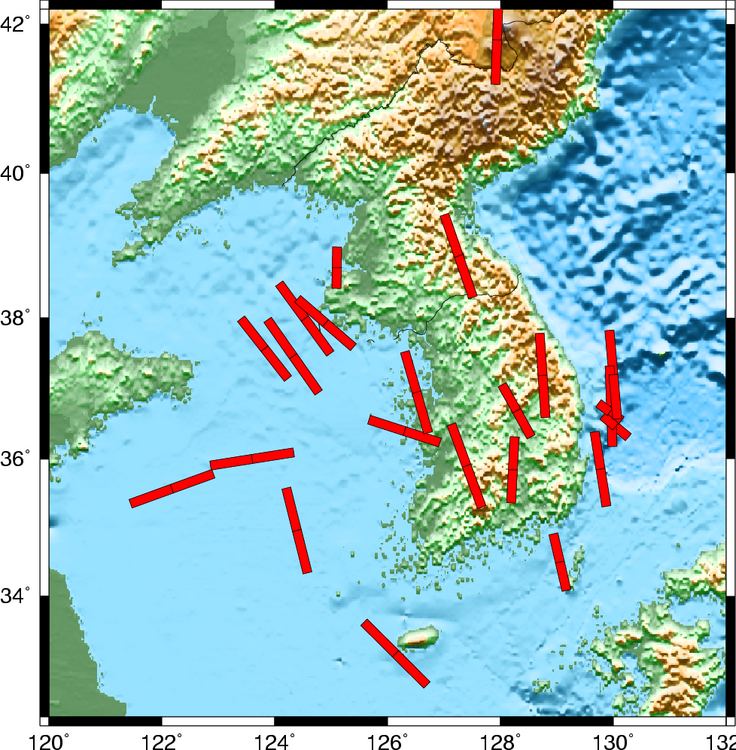
Figure 1 shows the earthquake locations provided by KMA for the 2000-2005 time period. The larger earthquakes during this period have been offshore, as are many of the smaller earthquakes. If this is a reflection of historical seismicity patterns, then earthquake hazard estimates based on earthquake reports may not properly characterize the spatial pattern of seismicity.
Kim and Kraeva (1999) and Kim et al (2000) used digital broadband seismic waveforms recorded at the IRIS station at Inchon to determine to determine source parameters for the 1996 Youngwol and 1997 Kyongju earthquakes through moment tensor inversion. Because of the new data streams it is now possible to determine source parameters for earthquakes since 2000.
Velocity Model
Waveform inversion requires a realistic crustal velocity model for generating the Green's functions required for the inversion. Although there are many crustal velocity models for Korea based on first arrival information and even receiver function or joint inversion of receiver functions and surface-wave dispersion (Chang and Baag, 2005), we decided to develop our own models. The tool used was is the joint inversion of receiver functions and surface-wave dispersion documented in Herrmann and Ammon (2002b). The idea of the joint inversion technique is that the surface-wave dispersion data provide constraints on the crustal S-wave velocity structure and that the receiver functions define the sharpness and travel times to velocity discontinuities in such a manner that both independent data sets are well fit. Yoo (personal communication) noted the same differences in receiver function crustal models as described by Chang and Baag (2005).
Since the earthquake signals that will be used for source modeling are dominated by a surface wave with spectral content in the 5 – 25 second period range, we need a very good upper crustal model. This means that details of the the sharpness of and depth to the Moho are not that important. For model we use receiver functions at the KIGAM station SNU on the Seoul National University campus in Seoul.
Surface wave dispersion should also be specific to Korea. Fortunately global tomography studies done by Harvard and regional group velocity studies done by LLNL (M. Pasyanos, personal communication) provide dispersion data in the 15 – 150 second period range. Initial inversions using these data did not yield adequate crustal velocity models for use in waveform inversion. (Our criteria for evaluation a model is whether the model provides synthetics with the same shape as the observed waveforms). To focus on the shorter periods required for to constrain the upper crust, we applied the phase-velocity estimation technique of McMechan and Yedlin (1981) to teleseismic Rayleigh wave signals recorded by the KMA and KIGAM broadband stations. Although developed for use with a linear exploration array, this technique worked well when the Korean observations were projected onto a great circle path from the epicenter through the network. The stacking procedure was improved by first applying a phase-match filter to the isolate the fundamental mode signal from the waveforms.
Group velocity for Korea were initially obtained from a few poorly located mining explosions and from the results of multiple filter analysis of local earthquake signals. These results were scattered, but did provide an indication of the group velocity trends. We recently have been able to get estimates of inter-station group velocity dispersion by applying our variation of cross-correlation of ground noise (Campillo and Paul, 2003; Shapiro et al 2005) through a joint project with Mr. K.-H. Cho of SNU. From his results (Figure 5) we used the group velocities for the station pairs CHC-SEO, CHC-SES, DGY-SEO and DGY-SES since these paths were near to the SNU station. Figure 2 shows the dispersion observations used in the inversion. Figure 3 shows the observed and predicted receiver functions for the final model, which we named t5.invSNU.CVEL. This model consisted of many thin layers. We then aggregated layers with similar velocities to reduce the number of layers in the model. This model was named t6.invSNU.CVEL and was tested by running the joint inversion again for final adjustments. A truncated version of the model, dropping most of the upper mantle, was used to generate Green's functions (Table 1).
Figure 4 shows many of the velocity models considered for waveform modeling. The CUS model developed for the central US performed well in spite of the wrong Moho depth. This model evidently has the required average upper crust shear-wave velocities. A common feature of the joint inversion models is a sharp Moho, a uniform crustal velocity and a thin lower velocity surface layer.
To visualize the consequences of these different models, a waveform inversion, with time shifts, was run for the April 26, 2004 earthquake. This earthquake was selected because of its relatively large size and because of its location on the peninsula, surrounded by KMA stations. Thus the epicenter is well constrained. A waveform inversion grid search for source parameters was performed for three of the crustal velocity models used. A comparison of observed and predicted traces is given in Figure 6. Fits were made for the 0.02 – 0.15 Hz frequency band, and a distance dependent weighting was applied. The agreement between the observed and predicted waveforms in Figure 6 are good, although some subtle differences are seen. Comparison of the ULJ traces at 143 km, indicates that although the P-wave arrival may align, the surface-wave pulse is typically predicted later. The problem of origin time is tied up with the velocity model, but not necessarily with depth because the surface wave pulse broadens at source depth increases. It is difficult to choose among the two Korea based models, but it is comforting that a joint-inversion model using phase velocity dispersion in the 5 – 175 second period band can form the basis for waveform inversion. The application of this model at greater distances awaits data from similarly well constrained earthquakes.
Source Inversion
Source inversion results are documented for each earthquake studied on the Saint Louis University web page noted in Table 2. Since we did not have velocity model for Korea, we used a spectral amplitude matching technique (Herrmann, 1979). This approach uses multiple filtering to isolate the dispersive surface wave and its spectral amplitude. The spectral amplitudes are relatively insensitive to the details of the crustal velocity structure. One we had a good velocity model for Green's functions, we used a waveform grid search after implementing a waveform shifting technique similar to that of Zhu and Helmberger (1996). To facilitate studies, all Green's functions are precomputed, all processing is scripted, as is the generation of the web page. If the earthquake is large enough, we can provide a documented solution within one hour of receiving the digital waveforms.
The source inversion results are given in Table 2. We note that the solution for the 1996 earthquake is essentially the same as that given by Kim and Kraeva (1999), except for the moment magnitude. Their seismic moment was 4 times larger than ours because they were unaware that the LH and BH channels at the IRIS station at INCN were different. We note the corrected moment magnitude for future reference.
Moment magnitudes vary from 3.24 to 5.08. The ability the determine waveform based source parameters for the smallest event attests to the quality of the network and the station sites in Korea. The determination of source parameters with Mw 3.5 or smaller depends on the background noise level which varies seasonally. We have noticed that many waveforms appear simple in the 0.3 – 1.0 Hz frequency band, but that correct Green's functions may be harder to obtain for the higher frequencies.
Discussion
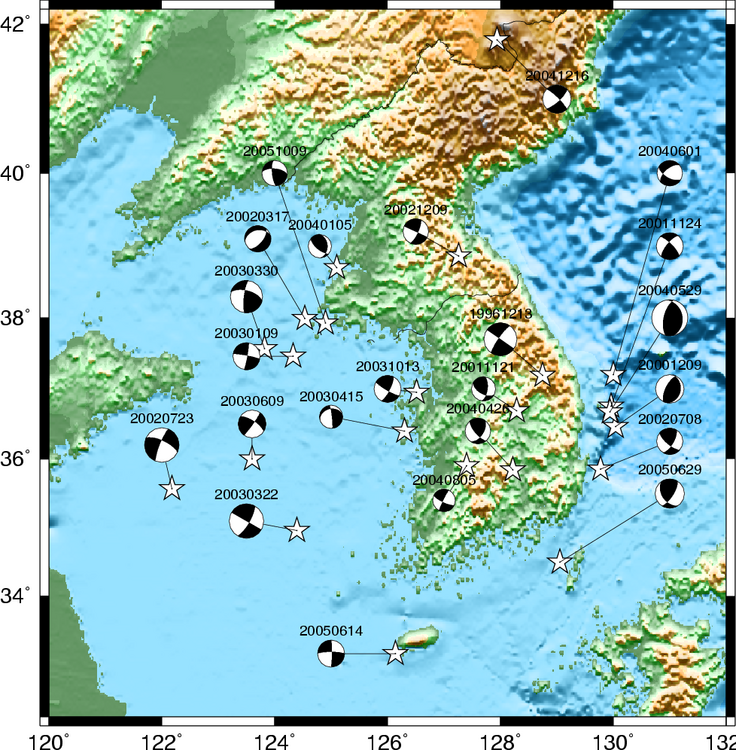
The focal mechanisms are presented in Figure 7a. Several features are apparent. First, few of these larger earthquakes occur on the peninsula. Second, there are no apparent trends of epicenters or focal mechanism on the peninsula. However, the earthquake just offshore in southeast Korea seem to group spatially near a rapid gradient in seafloor depth. This last comment is based on the map database used, and can be further tested with better data available at KIGAM.
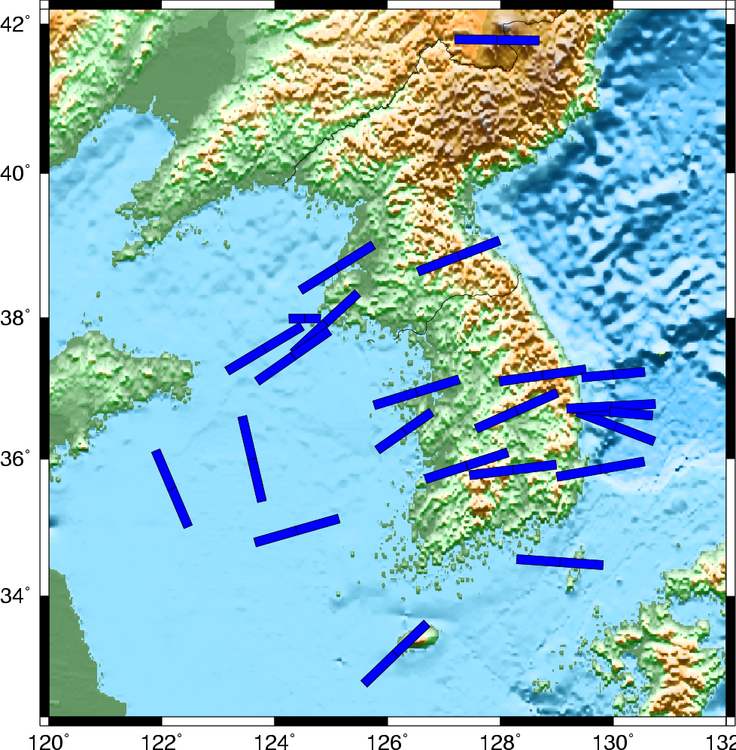
Figures 7c and 7d present projections of the focal mechanism P- and T-axes onto the horizontal plane. Except for a few earthquakes in the western part of the Yellow Sea, the P-axis trends east to northeast. The T-axes also have uniform alignment except in the west.
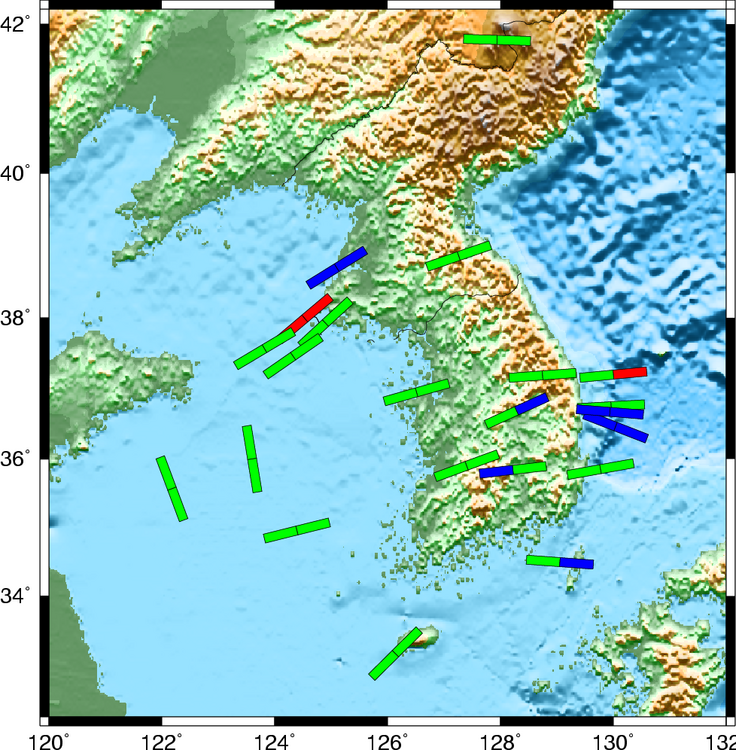
Figure 7b presents the faulting classification and orientation of maximum compressive stress using the convention of Zoback (1992). The focal mechanisms have significant strike-slip motion. The uniform orientation of the compressive stress axes, except for the two western earthquakes, may reflect the importance of the stress fields generated by the plate collision of of Japan.
We are very pleased with the picture that is emerging concerning the earthquake process in Korea. We cannot say anything about whether the earthquakes are associate with new faults or reactivation of existing faults. The high strike-slip component exhibited in the mechanisms has strong implications on the scaling of earthquake strong motion near the source (Herrmann and Malagnini, 2006). This source study is also valuable in providing moment magnitudes to constrain high frequency ground motion scaling for Korea (Jeon and Herrmann, 2006).
Acknowledgments
This work was made possible through cooperative work between Saint Louis Univeristy and Seoul National University. The high quality digital data were provided by KMA and KIGAM. The research at Saint Louis University was sponsored by DOE Contract DE-FC52-04NA25539.
References
Campillo, M., and A. Paul (2003). Long-range correlations in the diffuse seismic coda, Science 299, 547-549.
Chang, S.-J., and C.-E. Baag (2005). Crustal structure in southern Korea from joint analysis of teleseismic receiver functions and surface-wave dispersion, Bull. Seism. Soc. Am. 95, 1516-1534.
Chiu, J.-M. And S. G. Kim (2004). Estimation of regional seismic hazard in the Korea Peninsula using historical earthquake data between A.D. 2 and 1995, Bull. Seism. Soc. Am. 94, 269-284.
Herrmann, R. B. (1979). Surface-wave focal mechanisms for eastern North American earthquakes with tectonic implications, J. Geophys. Res. 84, 3543-3552.
Herrmann, R. B., and C. J. Ammon (2002a). Computer Programs in Seismology – 3.30: Source inversion, http://www.eas.slu.edu/People/RBHerrmann/CPS330.html, 99pp.
Herrmann, R. B., and C. J. Ammon (2002b). Computer Programs in Seismology – 3.30: Surface waves, receiver functions and crustal structure, http://www.eas.slu.edu/People/RBHerrmann/CPS330.html, 110pp.
Herrmann, R. B. and L. Malagnini (2006). Interpretation of high frequency ground motion from regional seismic network observations, Bull. Seism. Soc. Am. 96 (in revision).
Jeon, Y. S., and R. B. Herrmann (2006). High frequency earthquake ground motion scaling for the Korean Peninsula, Bull. Seism. Soc. Am. 96 (draft).
Kim., S. G., and N. Kraeva (1999). Source parameter determination of local earthquakes in Korea using moment tensor inversion of single station data, Bull. Seism. Soc. Am. 89, 1077-1083.
Kim, S. G., N. Kraeva, and Y.-T. Chen (2000). Source parameter determination of regional earthquakes in the Far East using moment tensor inversion of single-station data, Tectonophysics 317, 125-136.
Lee., K., N. S. Chung and T. W. Chung (2003). Earthquakes in Korea from 1905-1945, Bull. Seism. Soc. Am. 93, 2131 – 2145
McMechan, G. A. and M. J. Yedlin (1981). Analysis of dispersive waves by wave field transformation. Geophysics 46, 869-874
Shapiro, N.M. M. Campillo, L. Stehly, and M.H. Ritzwoller, High resolution surface wave tomography from ambient seismic noise, Science, 307(5715), 1615-1618, 11 March 2005.
Wapenaar, K. (2004). Retrieving the elastodynamic Green’s function of an arbitrary inhomogeneous medium by cross corrleation, PRL 93, 254301, 4pp.
Zoback, M. L., (1992). First and second-order patterns of stress in the lithosphere: The World Stress Map Project. J. Geophys. Res., 97, B8, 11703-11728.
Zhu, L., and D. V. Helmberger (1996). Advancement in source estimation techniques using broadbandr egional seismograms, Bull. Seism. Soc. Am. 86, 1634-1641.
Appendix
|
Table 1. Korea Velocity Model (model96 format) |
|
MODEL.01 KOREA.invSNU.CUVEL6 30 iteration joint inversion truncated ISOTROPIC KGS SPHERICAL EARTH 1-D CONSTANT VELOCITY LINE08 LINE09 LINE10 LINE11 H(KM) VP(KM/S) VS(KM/S) RHO(GM/CC) QP QS ETAP ETAS FREFP FREFS 1.00 5.38 3.00 2.57 847 598 0.00 0.00 1.00 1.00 1.00 5.80 3.23 2.66 847 598 0.00 0.00 1.00 1.00 1.00 6.17 3.44 2.75 847 598 0.00 0.00 1.00 1.00 3.00 6.28 3.50 2.78 847 598 0.00 0.00 1.00 1.00 5.00 6.32 3.52 2.79 847 598 0.00 0.00 1.00 1.00 5.00 6.41 3.57 2.82 847 598 0.00 0.00 1.00 1.00 4.00 6.55 3.65 2.86 847 598 0.00 0.00 1.00 1.00 5.00 6.64 3.70 2.88 847 598 0.00 0.00 1.00 1.00 2.50 6.65 3.71 2.88 847 598 0.00 0.00 1.00 1.00 2.50 7.09 3.95 3.01 847 598 0.00 0.00 1.00 1.00 2.50 7.91 4.41 3.28 847 598 0.00 0.00 1.00 1.00 2.50 7.89 4.40 3.27 847 598 0.00 0.00 1.00 1.00 5.00 7.86 4.38 3.26 847 598 0.00 0.00 1.00 1.00 5.00 7.56 4.22 3.16 847 598 0.00 0.00 1.00 1.00 5.00 7.75 4.32 3.22 847 598 0.00 0.00 1.00 1.00 |
|
Table 2. Source mechanism parameters ( http://www.eas.slu.edu/Earthquake_Center/MECH.KR )
|
||||||||
|
Date |
Time (UT) |
Lat(N) |
Lon(E) |
H(km) |
Mw |
Stk |
Dip |
Rake |
|
1996/12/13 |
04:10:16 |
37.19 |
128.75 |
6 |
4.70 |
310 |
85 |
20 |
|
2000/12/09 |
09:51:00 |
36.46 |
130.04 |
12 |
4.06 |
10 |
25 |
75 |
|
2001/11/21 |
01:49:12 |
36.69 |
128.29 |
8 |
3.42 |
120 |
55 |
35 |
|
2001/11/24 |
07:10:31 |
36.75 |
129.96 |
12 |
3.81 |
315 |
75 |
20 |
|
2002/03/17 |
00:26:38 |
37.99 |
124.53 |
6 |
3.74 |
255 |
35 |
-60 |
|
2002/07/08 |
01:49:12 |
35.85 |
129.77 |
19 |
3.75 |
130 |
70 |
25 |
|
2002/07/23 |
12:48:04 |
35.57 |
122.18 |
17 |
4.86 |
295 |
70 |
-170 |
|
2002/12/09 |
22:42:50 |
38.86 |
127.26 |
8 |
3.65 |
295 |
90 |
-15 |
|
2003/01/09 |
08:33:18 |
37.46 |
124.33 |
9 |
3.86 |
280 |
85 |
-5 |
|
2003/03/22 |
20:38:39 |
34.96 |
124.39 |
17 |
4.83 |
300 |
90 |
-15 |
|
2003/03/30 |
11:10:56 |
37.57 |
123.82 |
13 |
4.60 |
285 |
60 |
15 |
|
2003/04/15 |
17:55:25 |
36.4 |
126.3 |
8 |
3.24 |
255 |
30 |
-10 |
|
2003/06/09 |
01:14:04 |
36.00 |
123.60 |
15 |
3.89 |
35 |
85 |
20 |
|
2003/10/13 |
09:12:05 |
36.95 |
126.51 |
11 |
3.79 |
120 |
80 |
15 |
|
2004/01/05 |
16:49:41 |
38.7 |
125.1 |
10 |
3.33 |
130 |
65 |
65 |
|
2004/04/26 |
04:29:25 |
35.84 |
128.22 |
12 |
3.62 |
140 |
70 |
40 |
|
2004/05/29 |
10:14:24 |
36.67 |
129.94 |
11 |
5.08 |
350 |
30 |
70 |
|
2004/06/01 |
11:22:18 |
37.2 |
130.0 |
15 |
3.59 |
120 |
60 |
-35 |
|
2004/08/05 |
21:32:54 |
35.9 |
127.4 |
8 |
3.21 |
115 |
75 |
-5 |
|
2004/12/16 |
18:59:14 |
41.79 |
127.94 |
8 |
3.97 |
315 |
80 |
-15 |
|
2005/06/14 |
22:07:02 |
33.15 |
126.14 |
08 |
3.78 |
270 |
80 |
-5 |
|
2005/06/29 |
14:18:05 |
34.50 |
129.05 |
11 |
4.13 |
145 |
45 |
30 |
|
2005/10/09 |
23:51:06 |
37.93 |
124.90 |
8 |
3.58 |
275 |
60 |
20 |
|
|
|
Fig. 1. Seismicity of the Korean Peninsula 2000-2005 (KMA). |
|
Figure 2. Dispersion values used for the t5.INVSNU and t5.inv SNU.CVEL joint inversions. |

|
|
|
Fig. 3. Receiver function fits from the joint inversion at station SNU (KIGAM). The left panel shows the starting (blue dashed) and final (red) shear-wave velocity models. Each receiver function (blue observed and red predicted) is annotated with the station name, Gaussian filter parameter, goodness of fit, ray parameter and event identification. |

|
|
Figure 4. Comparison of models used for synthetics. START/start.mod is the starting model. |

|
|
|
|
Figure 5. Comparison of interstation group velocities for station pairs in the Korean peninsula (orange) with theoretical dispersion for the CUS model (green) and t5.invSNU.CVEL (blue) |
|

|
|
|
Figure 6. Comparison of observed and predicted filtered waveforms at selected stations of the KMA network for the 26 APR 2004 earthquake. The epicentral distances to the stations DAG, BUS, ULJ and CHC are 62, 104, 143 and 217 km, respectively. The observed traces are plotted in red. The number adjacent to each predicted trace is the time shift in seconds required for maximum correlation. The traces for each component of a station are plotted to the same scale. All traces start 5 seconds before and continue to 90 seconds after the origin time, and are bandpass filtered using a 3-pole high pass Butterworth at 0.02 Hz followed by a 3-pole low pass Butterworth filter at 0.15 Hz. The peak filtered amplitudes in meters/sec is indicated. |

|
( |
( |
|---|---|
|
( |
( |
|
Fig. 7. Focal mechanism results for the Korean Peninsula and surrounding area. (a) Focal mechanisms and earthquake locations. A lower hemisphere equal area projection is used. Compressional quadrants are in black. (b) Orientation of maximum compressive stress axis using the convention of Zoback (1992). Green, red and blue colors indicate strike-slip, normal and thrust mechanisms. Mixed colors indicate oblique mechanisms. (c ) and (d) Orientation of focal mechanism P- and T-axes, respectively with length indicating projection onto horizontal plane. |
|
CONNECT BROADBAND ESTABLISHES VIDEOCON ADVANCED COMMUNICATION LAB AT PEC
FSH BROADBAND NETWORK FEASIBILITY PROJECT CHARGE TO IMPLEMENT
HORIZON TELCOM AND CORNING CABLE SYSTEMS BRING BROADBAND BENEFITS
Tags: broadband source, kigam broadband, source, inversion, seismic, korean, using, digital, broadband
- PROGRAMA 1442OCPE “DESARROLLO DE POLÍTICAS DE COMERCIO EXTERIOR” COMPONENTE
- STOP VAWA RECOVERY ACT ADMINISTRATIVE MANUAL ADDITIONS CHAPTER 1
- COLLEGE OF HUMAN SCIENCES GRADUATE SCHOOL BOARD GUIDELINES
- 天津外国语大学滨海外事学院德语系本科毕业论文模式 DIE FORM DER ABSCHLUSSARBEIT FORM UND LAYOUT
- RESCISÃO DE TERMO DE COMPROMISSO DE ESTÁGIO CIDADE
- CASOS DE ÉXITO MICROSOFT MICROSOFT® WINDOWS® XP TABLET PC
- RADWANDERGRUPPE „MONTAG“ VFL OLDENTRUP TERMINPLAN 1 HALBJAHR 2018 DATUM
- KRIMINALITET SANKCIJE ( J ) 1 J MOTYL ALEXANDER
- TC ULAŞTIRMA BAKANLIĞI KARA ULAŞTIRMASI GENEL MÜDÜRLÜĞÜ SAYI
- PROTOCOLO GENERAL DE ACTUACIÓN ENTRE LA UNIVERSIDAD DE
- CITED FRÍASNAVARRO D (2009) DAVIS INTERPERSONAL REACTIVITY INDEX (IRI)
- IEEE POWER ELECTRONICS REGULAR PAPERLETTERCORRESPONDENCE IEEE TRANSACTIONS ON POWER
- LEY 764 DE 2002 (JULIO 31) DIARIO OFICIAL NO
- VAS VABITA NA 8 SLOVENSKE PREVENTIVNE DNEVE NA TEMO
- 20 NISAN 2006 TARIH SAYI 26145 KARAR SAYISI
- SHEEP BRAIN DISSECTION GUIDE NEUROANATOMICAL TERMS OF REFERENCE AXES
- INPUT 2 IF YOU MAKE A MISTAKE WHEN INPUTTING
- ISTRAŽIVANJE O ISKUSTVIMA DJECE PRILIKOM KORIŠTENJA INTERNETA I MODERNIH
- WWWFBKVALITETSE RESULTATANALYS I FB KVALITET DIN TILLGÅNG TILL QA
- MATHEMATIK BAOBAB JEANS ADOLESZENZ FLIRT GLOSSAR KOMMUNALPOLITIK SYMPOSION START
- 19 MESTRADO EM ODONTOLOGIA MANTIDA PELA ASSOCIAÇÃO PRUDENTINA DE
- SEMINARIO 17 DE MAYO “NUEVOS RETOS DEL EMPLEO EN
- LA MAYOR HAZAÑA DE ALEJANDRO MAGNO COMEDIA ATRIBUIDA
- DOCUMENTOS DE COTIZACIÓN MSPAS NO 2055HBEDAMC045 COMPRA DE MEDICAMENTOS
- RESOLVING PARALLEL AND PERPENDICULAR TO AN INCLINED PLANE INCLUDING
- BUSCADOR DE CARTAS DE PAPEL LISTADO COMPLETO POR
- PRESENTO LA DECLARACIÓN DE LA RENTA DE MI UNIDAD
- A 1 NURODYKITE VEIKSNIUS KURIE DIDINS NORMALIOS KOKYBĖS A
- PRZEWODNIK INFORMUJĄCY O DOSTĘPNYCH FORMACH OPIEKI ZDROWOTNEJ POMOCY SPOŁECZNEJ
- [pdk451] `test Unit` Fails Early but `bundle Exec Rake
 PODYPLOMOWE STUDIA ELEMENTY METODOLOGII BADAŃ EMPIRYCZNYCH W MEDYCYNIE I
NZQA UNIT STANDARD 27710 VERSION 3 PAGE 4 OF
 FORM 412—GENERAL INFORMATION (AMENDMENT TO REGISTRATION OF A FOREIGN
 PRIJAVNICA ZA RADIONICE CIKLUSA TJELESNE PSIHOTERAPIJE 20122013 IME I
LOGO O RAZÓN SOCIAL DE LA EMPRESA CONTRATISTA FORMATO
 STUDENT PLACEMENT APPLICATION FORM FRAME1 NAME DATE OF BIRTH
 PROPUESTA DEL PLAN DE ESTUDIO CURSO ACADÉMICO 20
 OR APPLICATION FOR EMPLOYMENT CASPER MEDICAL IMAGING PC REFERRED
CULTURAL DIVERSITY A COALITION OF THE WILLING GLOBALIZATION HAS
SPOJENÁ ŠKOLA INTERNÁTNA ABOVSKÁ 24418 044 11 ŽDAŇA SMERNICA
INFORME APORTE PRINCIPALES 7 AUSPICIADORES PRENSSAM PERIODO DIC 2002DIC
 E UROPEAN PARTNERSHIP FOR ENERGY AND THE ENVIRONMENT PRESS
DOCUMENTATION TURABIAN STYLE SHORT FORMS FOR NOTES THE FOLLOWING
 FORMULARIO NO1 INFORMACIÓN INSTITUCIONAL DE LA ORGANIZACIÓN PROPONENTE
9 ÉSZLELÉSKÉPZELET KÉPIKÉPZELETI FOLYAMATOK 1 TÖRTÉNETI ÁTTEKINTÉS
1º CERTAMEN NACIONAL DE RELATOS CORTOS “DR GUERRERO PABÓN”
 ACC249 PRESCRIPTION REIMBURSEMENT FORM COMPLETE THIS FORM TO REQUEST
 TSUNAMI BUOY VOLCANO MONITOR DOPPLER RADAR WATER GAUGE SEISMOMETER
 DECRETO 192018 DE 21 DE JUNIO DE DESCONCENTRACIÓN DE
 BILBAO 11 DE MAYO DE 2006 25 ANIVERSARIO DEL
