TEXTILE AND WEARING APPAREL INDUSTRY GENERAL CONDITIONS TEXTILE INDUSTRY
2 TECHNOLOGY UPGRADATION FUND SCHEMETEXTILE SECTOR(TUFS) PURPOSE200400 ESPECIFICACIÓN DE GEOTEXTILES TEJIDOS DESCRIPCIÓN GEOTEXTIL TEJIDO
ACUERDO SOBRE LOS TEXTILES Y EL VESTIDO LOS MIEMBROS
AGREEMENT ON TEXTILES AND CLOTHING MEMBERS RECALLING THAT MINISTERS
AUSSCHREIBUNGSUNTERLAGEN ANGEBOT ÜBER LIEFERUNG UND VERLEGUNG TEXTILER BODENBELÄGE INKLUSIVE
CAP 58 CAPÍTULO 58 TEJIDOS ESPECIALES SUPERFICIES TEXTILES CON
Textile and Wearing Apparel Industry
Textile and Wearing Apparel Industry
General Conditions
Textile industry is extremely significant to Thai economic development. There are fully processing cycles from fiber producing, spinning, weaving, knitting to dyeing, and garments leading to huge scale of employment and foreign income, especially in 2003 (Jan.–Oct.) the export value is over US$5,000 million. In particular, garment has the fourth highest export value after electronics, electrical circuits board, motor car, equipment and parts.
However, in 2003 (Jan.–Oct.), export value of textile products is US$4,508.0 million increased by 6.3 %, compared to the same period of 2002 in almost every market such as Japan, Hong Kong, China, Germany and France, except for the U.S. and United Kingdom, since the world economy has been decelerated along with more fierce price competition, especially from significant competitors such as China, Indonesia and Vietnam.
Production Structure
Textile and wearing apparel industry has comprised with 3 major categories as follows:
Upstream Industry: fiber industry and spinning industry
Midstream Industry: weaving, knitting, dyeing, screening and furnishing industries
Downstream Industry: garment industry and other textile products industry
Number of Factory and Labor by Industrial Category
-
Industrial Category
Factory
Labor
2001
2002
2001
2002
Fiber
17
18
15,340
15,600
Spinning
149
150
60,470
60,580
Weaving and Knitting
1,332
1,345
118,520
118,910
Dyeing, screening and furnishing
405
409
46,750
59,930
Clothing
2,641
2,648
840,460
840,850
Total
4,544
4,570
1,081,540
1,082,870
Source: Department of Industrial Works, Ministry of Industry
Number of Factory
In 2002, there are 4,570 factories in textile industry. The most changing number of factory is the fiber industry which has increased by 5.9% compared to 2001 and the least changing is the clothing industry increased by 0.3% compared to other industrial categories.
Number of Labor
In 2002, the maximum employment is in the wearing apparel industry that is 77.7%; followed by weaving and knitting industry (11.0%); spinning (5.6%), dyeing, screening and furnishing (4.3%), and fiber industry (1.4%), respectively. In the past, weaving and knitting industry has used huge amount of labors, but nowadays machinery has been used increasingly; therefore, modern technologies have been brought into the production processes. Regarding the fiber industry, it has used great amount of capital and high technology; then there is the least employment as 1.4% of all employment in textile industry. Since 1997 the employment has decreased continuously because of Baht devaluation that leads to the increasing costs of production and raw materials. Most raw materials are imported from abroad, resulting in an increasing production cost and the employment must have been decreased in order to reduce such cost. Labor is the significant varied factor of textile industry because it is the labor intensive industry.
Export Conditions
In 2003 (Jan.–Oct.), an export value of Thai textile is US$4,508.0 million increased by 6.3% compared to US$4,240.6 million in the same period of 2002.
Value:
SD$ Million
(+6.3%)
Graph 1: Thai Textile Export in 2003 (Jan. – Oct.)
Source: Information Technology and Communication Center, by cooperation of the Customs Department
Remark: Year 2003 is primary data.
Important Exported Textile Products:
Garment: In 2003 (Jan.–Oct.), the export value is US$2,298.8 million increased by 2.3% compared to US$2,247.3 million in the same period of 2002. The main export markets are the U.S., United Kingdom, Japan, Germany and France with ratio of 55.2%, 6.0%, 5.7%, 3.6% and 3.4% respectively.
Fabric and Yarn: In 2003 (Jan.–Oct.), the export value is US$1,145.3 million increased by 9.6% compared to US$1,045.3 million in the same period of 2002. The main export markets are the U.S., China, Japan, Hong Kong and United Arab Emirates with ratio of 8.4%, 6.2%, 5.4%, 5.3% and 4.8% respectively.
Fabric: In 2003 (Jan.–Oct.), the export value is US$709.8 million increased by 7.2% compared to US$661.9 million in the same period of 2002. The main export markets are the U.S., United Arab Emirates, Hong Kong, China and Bangladesh with ratio of 9.1%, 7.5%, 5.4%, 5.0% and 4.9% respectively.
Yarn and Fabricated Yarn: In 2003 (Jan.–Oct.), the export value is US$435.5 million increased by 13.6% compared to US$383.4 million in the same period of 2002. The main export markets are South Korea, Japan, China, U.S. and Malaysia with ratio of 9.8%, 9.3%, 8.2%, 7.1% and 5.5% respectively.
Cotton Yarn: In 2003 (Jan.–Oct.), the export value is US$96.0 million increased by 22.1% compared to US$78.6 million in the same period of 2002. The main export markets are Japan, China, Malaysia, South Korea and U.S. with ratio of 20.2%, 17.4%, 10.1%, 7.6% and 5.7% respectively.
Fabricated Yarn: In 2003 (Jan. – Oct.), the export value is US$339.5 million increased by 11.4% compared to US$304.8 million in the same period of 2002. The main export markets are South Korea, U.S., Turkey, Japan and Hong Kong with ratio of 10.4%, 7.5%, 6.6%, 6.2% and 5.5% respectively.
Fabricated Fiber: In 2003 (Jan. – Oct.), the export value is US$237.8 million increased by 18.0% compared to US$201.5 million in the same period of 2002. The main export markets are China, Indonesia, Hong Kong, U.S. and Iran with ratio of 16.3%, 15.4%, 13.6%, 6.2% and 5.3% respectively.
Household and Furnishing Textiles: In 2003 (Jan. – Oct.), the export value is US$153.8 million increased by 20.6% compared to US$127.5 million in the same period of 2002. The main export markets are the U.S., Japan, Saudi Arabia, Singapore and Hong Kong with ratio of 47.8%, 18.9%, 3.2%, 2.7% and 2.6% respectively.
Export Market
The U.S. is the main market for Thai textile export with the value of US$1,570.6 million in 2003 (Jan.–Oct.) decreasing by 3.7% from US$1,631.2 million compared to 2002. This is 34.8% of total Thai textile export.
Japan. The export value is US$313.1 million equivalent to 7.0% of total Thai textile export. Most exported products are garment, fabric and yarn, fabricated fiber and other textiles.
G
Value:
SD$ Million
raph 2: Thai Textile Export in 2002 (Jan. –
Oct.) Categorized by Countries
Source: Information Technology and Communication Center, by cooperation of the Customs Department
Remark: Year 2003 is primary data.
Textile Import Conditions
In 2003 (Jan.–Oct.), there is an increasing import in almost all textile items with the total import value of US$1,996.4 million, increased by 4.3% from US$1,914.4 million compared to the same period of 2002. The significant imported products are as follows.
Fiber: In 2003 (Jan.–Oct.), the import value is US$537.8 million increased by 8.4% compared to US$496.0 million in the same period of 2002. The main import markets are the U.S., Australia, China, Mali and Japan with ratio of 27.6%, 21.3%, 9.7%, 5.1% and 4.7% respectively.
Yarn: In 2003 (Jan.–Oct.), the import value is US$315.8 million increased by 2.0% compared to US$322.4 million in the same period of 2002. The main import markets are China, Japan, Taiwan, Indonesia and South Korea with ratio of 27.4%, 13.8%, 13.1%, 8.9% and 6.3% respectively.
Fabric: In 2003 (Jan.–Oct.), the import value is US$793.7 million increased by 0.6% compared to US$789.3 million in the same period of 2002. The main import markets are China, Taiwan, Japan, South Korea and Hong Kong with ratio of 29.9%, 21.9%, 9.8%, 9.3% and 8.8% respectively.
Garment: In 2003 (Jan. –Oct.), the import value is US$112.0 million increased by 14.3% compared to US$98.0 million in the same period of 2002. The main import markets are China, Hong Kong, Italy, Japan and France with ratio of 55.6%, 13.8%, 4.6%, 4.6% and 2.9% respectively.
Graph 3: Thai Textile Import in 2003 (Jan. – Oct.)
|
|
2000 |
2001 |
2002 |
2002 (Jan-Oct) |
2003 (Jan-Oct) |
% Change |
|
Machinery |
417.7 |
443.2 |
474.7 |
389.3 |
351.1 |
-9.8 |
|
Fiber |
603.2 |
606.4 |
585.2 |
496.0 |
537.8 |
+8.4 |
|
Yarn |
406.8 |
377.4 |
374.5 |
322.4 |
315.8 |
-2.0 |
|
Fabric |
998.5 |
919.6 |
942.4 |
789.3 |
793.7 |
+0.6 |
|
Garment |
115.7 |
122.1 |
119.6 |
98.0 |
112.0 |
+14.3 |
Source: Information Technology and Communication Center, by cooperation of the Customs Department
Remark: Year 2003 is primary data.
The value of textile machinery importing in 2003 (Jan.–Oct.) is US$351.1 million decreasing by 9.8% compared to the same period of 2002 with US$389.3 million. The main import markets are Japan, Germany and Taiwan with ratio of 32.5, 20.0 and 12.2% respectively.
Summary and Trend in 2004
In 2003 (Jan.–Oct.), the textile and wearing apparel industry has been increasingly exported by 6.3% compared to the same period of last year. It has been constantly increased in garment, fabric, yarn and fabricated fiber, household and furnishing textiles, embroidered fabric-lace and other textiles according to domestic and overseas markets’ demand, including government’s measure through any projects such as exempted import duty for new machinery to replace the old one, enhancement project for Thailand to be the regional fashion center named “Bangkok: Fashion City”. Moreover, the free trade areas with the U.S. and EU would help to abase the effects of free trade in wearing apparel industry in line with WTO framework in 2005 at a certain level, especially agreement for reducing import duty of some textiles that Thailand could always be competitive with the free-trading countries.
Import of textile has increased by 4.3%, compared to the same period of last year except for weaving yarn and thread decreased by 2.0% especially from Taiwan, Indonesia and South Korea.
Trend of textile industry in the fourth quarter of 2003 and 2004 has been estimated that it is constantly improving because the entrepreneurs have to produce to meet with consumer demand in both domestic and overseas markets for any upcoming festivals including Christmas and New Year’s. For a whole year, this industry might be expanded not less than 5-6% or over US$5,000 million. To develop the textile and wearing apparel industry to draw foreign income continuously, the adjustment in production system with full network, proper production capacity, personnel, tax structure enabling to competition, pattern development, branding, updated information, distribution channel, maintaining existing market and expansion to new market, are necessary.
CAP 63 CAPÍTULO 63 LOS DEMÁS ARTÍCULOS TEXTILES CONFECCIONADOS
CERTIFICATION FEES FOR TEXTILE PRODUCTS TO GLOBAL ORGANIC TEXTILE
CHAPTER 53 OTHER VEGETABLE TEXTILE FIBRES PAPER YARN AND
Tags: industry general, apparel industry, industry, textile, general, conditions, apparel, wearing
- PROMOSANCRSPB SĂPTĂMÂNA EUROPEANĂ DE PREVENIRE A CANCERULUI DE COL
- M211 PART III SUBPART VI CHAPTER 1 SECTION A
- NA TEMELJU ČLANKA 3 ST 1 AL 7 ZAKONA
- APPENDIX 1 – ORGANISATIONAL STRUCTURE PLEASE SEE SECTION 15
- EL CONSEJERO CATALÁN PRESIDE EN MADRID EL ACTO DE
- CONSULTORÍA MANUAL DE PROVEEDORES DEL SERVICIO DE FACTURA ELECTRÓNICA
- TUDELA LISTA DEFINITIVA CONVOCATORIA PARA LA PROVISION MEDIANTE OPOSICIÓN
- NN 7710 19062010 MINISTARSTVO POLJOPRIVREDE RIBARSTVA I RURALNOG RAZVOJA
- SEITE 0 JUSTIZGEBÄUDE AM ALTEN EINLASS 1
- “2012 AÑO HOMENAJE AL DOCTOR D MANUEL BELGRANO”
- SPECIES FACT SHEET COMMON NAME SPOTTED TAILDROPPER VAR
- RAPORT PENTRU ANUL 2011 PRIVIND STRATEGIA UE PENTRU REGIUNEA
- SESSION NO 14 COURSE TITLE HAZARDS RISK MANAGEMENT
- KZ03ST1599 UL SOUDL SOP TRANSPORT BIOLOGICKÉHO MATERIÁLU DO LABORATOŘE
- CONCEDEN ADOPCIÓN PLENA DE UNA MENOR A PAREJA CON
- ŽÁDOST O REGISTRACI ELEARNINGOVÉ VZDĚLÁVACÍ AKCE ZAŘAZENÍ AKCE DO
- CERIMÔNIA DE ABERTURA DE JOGOS ESTUDANTIS IF LOCAL DATA
- BASES DEL CONCURSO PARA OTORGAR TITULARIDAD A UN ASPIRANTE
- SEMINARIO INTERNACIONAL “LA EXPERIENCIA DE LA ZLAN DE AMÉRICA
- CHILDREN’S SERVICES AND PROPERTY SERVICES GUIDANCE ON CONTRACTORS WORKING
- FORMULARZ DLA OGŁOSZENIODAWCÓW INSTYTUCJA INSTYTUT IMMUNOLOGII I TERAPII DOŚWIADCZALNEJ
- MATERIAL SAFETY DATA SHEET INFECTIOUS SUBSTANCES SECTION I
- CONTRATO DE PRESTACION DE SERVICIOS EDUCACIONALES DUPLICADO – CARPETA
- PARA ACCEDER A ESTE CUESTIONARIO DEBE PONERSE EN CONTACTO
- FORMULARIO PARA LA APROBACION DE UNA POLITICAUN PROCEDIMIENTO TITULO
- REPUBLIKA HRVATSKA MINISTARSTVO HRVATSKIH BRANITELJA OBJAVLJUJE JAVNI
- TOP OF FORM BOTTOM OF FORM 1NUMBER SYSTEMS CONVERSION
- ZESTAW PYTAŃ EGZAMINACYJNYCH NA EGZAMIN DYPLOMOWY CZĘŚĆ WSPÓLNA
- REPEAL OFAMENDED REGULATION 525 FEES FOR ARBITRATORS SECTION 1
- LATVIJAS REPUBLIKA OZOLNIEKU NOVADA PAŠVALDĪBA PIRMSSKOLAS IZGLĪTĪBAS IESTĀDE „ZĪLĪTE”
CERTIFICATION REQUIREMENT CHANGES FREQUENTLY ASKED QUESTIONS GENERAL
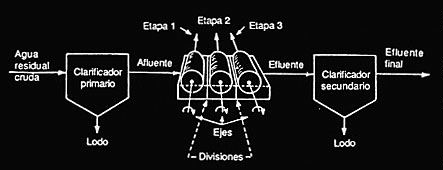 BIODISCOS (RBC) 81 INTRODUCCIÓN LOS BIODISCOS (RBC) SON SISTEMAS
TIPO EXAMEN A BIEN 0715 MAL 025 BLANCO 0
 REPUBLIC OF THE PHILIPPINES PIKIT WATER DISTRICT PIKIT
 ХАРКІВСЬКА ОБЛАСНА ДЕРЖАВНА АДМІНІСТРАЦІЯ ДЕПАРТАМЕНТ АГРОПРОМИСЛОВОГО РОЗВИТКУ Н А
OBSZAR EWALUACJI PROCESY ZACHODZĄCE W SZKOLE WYMAGANIE KSZTAŁTUJE SIĘ
9 LIETUVOS RESPUBLIKOS ŠVIETIMO MOKSLO IR SPORTO MINISTRAS ĮSAKYMAS
 8-6v20_weekly_placement_log_0_0
CONTRACT DE PROIECTARE ȘI EXECUȚIE LUCRĂRI NR DIN
15 RDCA2422006 CONTRALORIA GENERAL DE LA REPUBLICA DIVISIÓN
 T5 EJERCICIOS DE NÓMINAS CALCULA LAS SIGUIENTES NÓMINAS CASO
2010 NORMA ESMERALDA RODRÍGUEZ RAMÍREZ [EVALUACIÓN EDUCATIVA] EN EL
HONEY AND MUMFORD LEARNING STYLES QUESTIONNAIRE THIS QUESTIONNAIRE IS
A GUIDE TO CREATING TEXT DEPENDENT AND SPECIFIC QUESTIONS
WOJEWÓDZKI FUNDUSZ OCHRONY ŚRODOWISKA I GOSPODARKI WODNEJ W ZIELONEJ
SKAIDROJOŠS APRAKSTS 1 VISPĀRĒJĀ INFORMĀCIJA ŪDENSVADA PIEVADA AR ATZARIEM
 SANTO TOMAS EGUNATXOSNAK DÍA DE SANTO TOMÁS– TXOSNAS ESPEDIENTE
 “BUILDING THE SÁMI UNIVERSITY TRANSFORMING HIGHER EDUCATION & ENGAGING
 CONTE WEST HILLS MAGNET SCHOOL KINDERGARTEN SCHOOL SUPPLY LIST
 SENATE JOINT RESOLUTION NO 50 STATE OF NEW JERSEY
