DISCUSSION OF OPTIONS FOR TAKING PART AND ACTIVE PEOPLE
9 DISCUSSION PAPER ON EXPERT EVIDENCE ISSUESDISCUSSION FORUM RUBRIC WHAT IS A GOOD RESPONSE?
(PAPER PREPARED FOR PRESENTATION AND DISCUSSION AT THE ASLEA
03_31_CDDiscussion
11 BEDÖMNINGSMALL BILD OCH FUNKTIONSUNDERSÖKNINGAR MODIFIERAD “CASEBASED DISCUSSION” STLÄKARENS
113 SMALL GROUP DISCUSSION QUESTIONS DIRECTIONS AS A GROUP
Discussion of options for Taking Part and Active People Survey Integration
Charles Lound, Methodology Advisory Service, ONS, May 2012
Introduction
This paper is a discussion of possible options for integrating the Taking Part and Active People Surveys, written to inform a forthcoming consultation and is intended as guidance on the statistical issues involved with these options.
The work was done by the Methodology Advisory Service of the Office for National Statistics but should not be taken as formal approval for either approach from the ONS or the UK Statistics Authority.
The sample design for the two surveys
The Taking Part Survey uses a two-stage equal probability random sample of addresses similar to most large-scale Government surveys. The two-stage sampling, using a stratified sample of areas based on the census geography at the first stage, ensures that sampled addresses are sufficiently close together for cost-effective face-to-face interviewing. Interviews are sought with one randomly sampled adult aged 16 or over, with one child aged 11-15 if present and with the parent of one child aged 5-10 years if present. For the 2010/11 survey, this resulted in a sample size of around 14,000 adults, 1,100 children aged 11-15 and 1,600 younger children. This represented an adult response rate of 58%. The survey has two longitudinal elements, with the retention of sampled areas between certain years and the planned retention of half the adult sample under the current fieldwork.
The Active People Survey (APS) employs random digit dialling (RDD) to achieve around 168,000 telephone interviews with adults aged 16 or over per year. The sample is designed to achieve 500 interviews per year in each local authority. The sample does not cover households without a fixed landline in use. The response rate at around 28% is considerably lower than found on other large-scale Government surveys. Because of the RDD design it is not possible to attempt to increase the response rate by sending a letter and other information in advance or by following up initial non-responders with a face-to-face visit.
In addition to the standard APS design described above, the current survey includes a parallel face-to-face study using the APS questionnaire and a sample similar in design to the TPS to compare directly estimates under the two designs with the same questionnaire. This will help to understand the impact of the difference between the TPS and APS questions (see below). This will also provide further information on the impact of under-coverage of mobile-only households, following evidence from a previous methodological study1.
Sporting participation questions on the two surveys
In the TPS, the sporting participation questions are introduced with questions about walking and cycling in the last four weeks, followed by a question about whether the respondent has “done any sporting or active recreation activities” in the same period. The respondent is then asked to name these, without prompting, and the interviewer codes against a list of 69 sports or, if not listed, records the response. This initial unprompted question is followed up with a question with a showcard listing sports. These questions are followed up with questions on frequency and intensity. The showcard question is then repeated but with a reference period of twelve months, before a few follow up questions relating to sport.
The APS also begins with questions on walking and cycling. As the APS is conducted on the telephone, it is not possible to prompt using a showcard and reading a list would take too long, so only the first, unprompted question on sporting participation is asked, followed by questions on frequency and intensity. The survey then goes on to ask further questions about particular sports and for example topics such as club membership, instruction and volunteering.
Since the two surveys have run in parallel, there is already evidence about the levels of participation each reports, as summarised in the following chart. The chart shows four measures of participation, from the two surveys. The four measures differ according to whether participation is defined as requiring at least one or at least three sessions of 30 minutes duration per week, and whether recreational walking and cycling (labelled ‘rec W&C’) are included in the measures.
Figure 1: Comparison of sporting participation estimates from the Taking Part and Active People Surveys
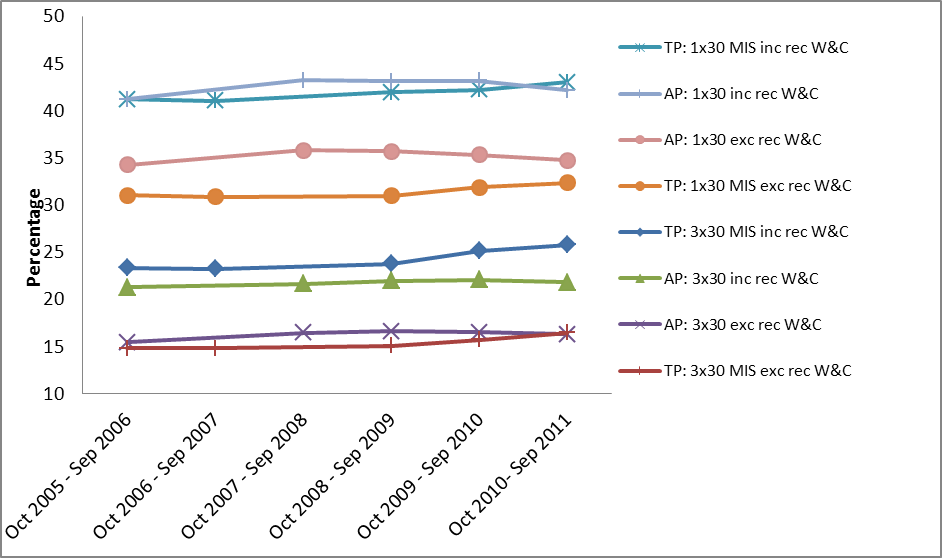
For two of the measures: 1x30 including recreational walking and cycling and 3x30 excluding recreational walking and cycling the two surveys give very similar results. The other two measures do differ, apparently systematically. When recreational walking and cycling is omitted from the 1x30 measure, the APS results are higher than the TPS results and when added to the 3x30 measure the TPS results are higher than the APS measure.
Taking this overall pattern we can deduce that TPS records a higher level of recreational walking and cycling than the APS. Since the questions are the same here, these differences must be due to differences in the people covered by and responding to the different surveys, or a ‘pure’ mode effect where the same people would respond differently to the same question in different modes. Both surveys employ weighting schemes which are intended to adjust for differences in the demographic distribution of the sample and population, although it is plausible that this does not account for all the bias due to response differences.
The other main difference is that when recreational walking and cycling are excluded, the two measures are similar on the 3x30 measure, but the APS scores higher on the 1x30 measure. We can speculate that this may be that responders to the APS are more likely to do some sport2, but that this is counteracted by the TPS’s supplementary showcard question that may encourage respondents to include more sports. We don’t have any stronger evidence for this speculation, but the study currently in the field with APS questions on a face-to-face survey should help to separate out these effects.
Comments on broad options
The Department for Culture Media and Sport and Sport England have together identified a number of options for integrating the existing surveys so that together they produce one definitive set of sporting participation estimates. These options can be consolidated into two main approaches.
We consider each of the two main approaches below and comment on the statistical implications of each compared with the current separate TPS and APS. In our discussion we mention making use of modelling methods for estimates for small areas. See the Appendix for a discussion on methods and examples.
In terms of overall costs, the all face-to-face option, A, is estimated to cost about the same as the current total cost of the two surveys and the part face-to-face, part telephone option, B, about 10% more.
Face-to-face surveys with common sporting participation questions
(See Option 3 in the consultation document – “Sport Participation Measurement – consultation on proposed changes”)
Under this option all interviewing is carried out face-to-face. The TPS would retain an achieved sample of 10,000 adults, together with personal interviews with 11-15 year olds and parental proxy interviews about 5-10 year olds, and would also retain its rotating panel design.
The APS would become a face-to-face survey with a sample design similar to the TPS but with an achieved sample of 32,800 individuals aged 14 and above.
The sporting participation questions would be harmonised using existing questions and selecting questions that can be administered in a consistent manner in both face-to-face and telephone modes.
For the TPS and its outputs, the only change under this option would be to the sporting participation questions which would be changed to a set harmonised across the two surveys. This will clearly lead to a change in the level on some of the participation measures for the TPS and change the relationships between different measures of cultural and sporting participation. The extent of this change depends on the exact questions chosen and the extent to which these differ from the existing questions. We can draw on existing knowledge of the relative levels and outputs from the current APS face-to-face study to inform the likely level of this change on estimates.
APS outputs would be affected by a change to the sample design, in its mode and coverage, size, and geographical distribution.
The change of sample mode from telephone to face-to-face will change the sampling approach. Firstly, the coverage will change to include mobile-only households which are not covered by the current RDD design.
This change may also affect the profile of the respondents and the way they answer questions. The higher level of response associated with face-to-face surveys is generally assumed to reduce non-response bias. Evidence for the impact of these changes will again be available from the parallel face-to-face study currently in the field.
The achieved sample size for sporting participation questions would fall from the current 168,000 to 42,800 which would lead to less precise (i.e. more variable) results nationally and regionally and would rule out making direct estimates for local authorities. This loss of precision would be partially mitigated by changing the sample distribution from one in which each local authority has the same sample size, to a proportionate sample for which no weighting is required for the geographical distribution, but then increased by using a clustered design as currently used on TPS.
So, taking these effects into account, we estimate that for estimates of participation overall and for individual sports, the standard errors and confidence intervals would increase by a factor of about 1.9. Consequently, if we apply the criterion of a coefficient of variation of 15%, the number of sports the survey can report on will fall from 28 to 21. It may be possible to improve the precision of these estimates using a modelling technique to borrow strength across sports with similar patterns but, as noted in the appendix, we have not, from a brief review, identified such a modelling technique.
There is a continuing requirement for estimates of sporting participation for local authorities. With 326 local authorities in England3, this option would lead to an annual average sample size of around 130 cases per local authority, with a wide range from around 30 cases up to 8004. A comparison with the modelled income estimates for from the Family Resources Survey in the appendix suggests that such a sample could be used to produce model-based estimates for local authorities annually, although we would be interested primarily in the local authority rather than the lower, MSOA level estimates described there. However, such modelled estimates would be suitable only for a descriptive analysis of the patterns of participation for different types of local authority and observed local changes in participation over time could not be attributed to local change.
Face-to-face surveys with a telephone boost for local estimates of sporting participation
(See Option 1 in the consultation document – “Sport Participation Measurement – consultation on proposed changes”)
Here, as with option A, the TPS would retain an achieved sample of 10,000 adults, together with personal interviews with 11-15 year olds and parental proxy interviews about 5-10 year olds, and would also retain its rotating panel design.
The current temporary face-to-face APS survey element would be retained and increased to an achieved sample size of 20,000. In addition to this there would be 130,000 APS telephone interviews. All the APS interviews would be with individuals aged 14 and above and the combined interviews distributed with equal allocation to enable local authority estimates.
The sporting participation questions would be harmonised using existing questions and selecting questions that can be administered in a consistent manner in both face-to-face and telephone modes.
As with the first option, the only change to the TPS and its outputs under this option would be the change to the questions and the likely consequences in terms of a step change in the level are as described there.
As the current APS has a face-to-face comparison study with 6,000 annual interviews in place, the changes proposed here represent a similar structure to the current set of surveys, albeit with adjusted sample sizes and better co-ordination of the sporting participation questions with the TPS.
The total achieved sample size for sporting participation questions under this option, including the TPS and both parts of the APS would be 160,000, similar in size to the current APS. However, the face-to-face and telephone parts to the survey may have different properties, so we consider the telephone part alone and then discuss options for integration.
Taking the telephone interviews alone, the survey can be used in much the same way as at present, with some loss of precision. With 130,000 interviews, the annual achieved sample size per local authority would be about 400, so for the two-year analysis by local authority the confidence interval around such estimates would rise by about 12% of their current size. Since the geographical survey allocation remains the same, the increase in confidence interval widths for national and regional estimates would also be about 12%.
As the precision is reduced, we may wish to turn to a modelling approach to improve the quality of the local authority estimates. Given the size and structure of the proposed two-year sample, this would appear to be closer to the modelling approach currently used to create estimates of unemployment, as described in the appendix. The benefits from modelling may not be as strong as we do not have such an obvious covariate as the claimant count for employment, but we can include estimates of random effects from the model, to reflect local effects picked up from direct estimation.
An alternative approach to modelling with these reduced sample sizes would be to accumulate the data over three years to achieve local authority sample sizes that are larger than under the current design. The main quality drawback is that the time lag between the reference period and the publication date is extended. This also further complicates comparisons over time as estimates for overlapping periods share some data in common.
The new feature with this option is the ongoing and increased face-to-face sample for the APS. Taken together with the data from the TPS, this will lead to 30,000 achieved face-to-face interviews on sports participation using a consistent methodology. Since with this option we would also have information from the larger telephone survey, we need to integrate these two sources to provide one definitive set of statistics at national, regional and local authority level.
To achieve this integration, we can calibrate the weights applied to the telephone survey data to ensure that the estimates from those data reproduce distributions seen in the face-to-face data. As well as achieving coherence between estimates from the two surveys, this should help to reduce biases present in the telephone survey that are not as likely to be present in the face-to-face survey. The method used to achieve this calibration will depend on the extent of the difference between the two sources. At one extreme the two sources may agree in terms of demographic and participation outcomes so no substantial adjustment would be required. Alternatively, it may be possible to bring the sources into agreement by weighting on demographic variables. At the other extreme, it may be necessary to force the participation outcomes to match at the national and regional level. Such adjustments also increase the variation in the weights applied to the survey data, which will tend to increase the variance in survey estimates, so we need to be aware of the balance between coherence and precision when making these adjustments. We await the results from the current comparison study to provide information on the likely level of adjustment required.
This option also raises the complex question of what is the best balance between the face-to-face and telephone elements of the APS, for a given fixed cost. The question is complicated further as it depends on which estimates are being considered, in terms of the chosen measure and geographic level, and also whether the focus is on the level at a point in time or in change. We saw earlier that the 1x30 excluding walking and cycling measure was about 2-3 percentage points higher for the APS than the TPS. We can compare surveys in terms of mean-squared error, summing the squared bias and variance to get an overall measure of accuracy. For the measure above, a point estimate from an unbiased survey of 30,000 individuals would have approximately the same mean-squared error as a survey of 50,000 individuals with a 2½ percentage point bias (although this analysis is sensitive to the bias assumption as a 4 percentage point bias would require an 180,000 for an equivalent mean-squared error.) On the other hand, the difference between the surveys appears to be fairly consistent over time, albeit in a period of little overall change, so it may be that there is no bias in measures of change for the telephone survey (relative to the face-to-face survey).
Internet data collection
The existing surveys make use of either face-to-face or telephone interviewing and the second of the two broad options presented here continues this mixed mode approach. As access to the internet increases, survey researchers in official statistics are keen to exploit online data collection as an additional means of data collection5. Internet data collection is usually implemented as a self-completion questionnaire delivered to the respondent in a web browser possibly via a link delivered in an email or through some process of registration.
There are several reasons for considering the inclusion of internet data collection. The costs of interview-administered surveys, particularly face-to-face, have been increasing with the increasing efforts required to make contact and to persuade people to take part. This is related to falling response rates and some see internet data collection as a tool in helping to address this falling response, particularly amongst groups most familiar with using the web. This offers an opportunity to deliver the survey in a form familiar to the respondent for the respondent to complete at their time of choosing.
In spite of this interest in the potential benefits, the implementation of internet data collection in official social surveys has been fairly limited, particularly with cross-sectional studies of the general population. The ONS has carried out pilot testing on its Opinions Survey and Labour Force Survey and included a web questionnaire option in the Census. The Understanding Society Survey and National Child Development Study, both longitudinal surveys, plan to include the web in their data collection in future waves. Other examples are focussed on particular groups in the population, including the Longitudinal Study of Young People in England, the Youth Cohort Study and the Student Income and Expenditure Survey.
As there is no sampling frame of internet users or email addresses we cannot sample directly for an exclusively internet-base survey. We can consider internet collection as part of a mixed mode strategy, such as sending an advance letter to a sample of addresses and asking residents to access a questionnaire. Relying on this single mode alone would return too low a response rate, so we would still need to include a face-to-face element in the survey to include those reluctant or unable to respond online. Alternatively, the internet option could be offered as an option once a respondent has been contacted in an RDD telephone sample, although the cost benefits would be much diminished as contact by the interviewer has already been made.
An online option is attractive as part of a longitudinal design where a respondent has already taken part in one wave of the survey and we are seeking to re-interview for a subsequent wave.
Generally, sequential strategies in which the cheaper mode of internet access is offered first and followed up with a more expensive mode only if the first approach is not successful are recommended over concurrent strategies where more than one mode is offered at the initial contact. It is unlikely that a mixed mode approach will increase response rates within current total costs, but it may be that comparable response rates can be achieved at reduced costs.
A number of methodological issues need to be addressed when considering offering an online option. One is that different people are more or less likely to take part in different modes at different stages of the survey. If proper control is kept over who responds at each stage, so we are clear about the routes into the achieved sample, then weighting can be used to attempt to control for potential biases.
Another major issue is that the choice of mode has an influence on the question design that can be employed. We described earlier the use of the showcard listing sports on the TPS, compared with an unprompted question on the APS. There are different options with a web version of that participation question. Should the question be presented as a long list of sports with a radio button next to each? It would make sense to split such a long list over three or four screens, but would a respondent diligently work through that long list, and if the attention is reduced towards the end, should this influence the order in which we list the sports? Alternatively, the question could be presented like the unprompted APS question, inviting verbatim responses. But this then would require a substantial and expensive office coding stage, attempting to interpret those responses.
The other questionnaire issue is the mode effect, when different responses are given by the same people to equivalent questions in different modes. This may be that more sports are recalled with the encouraging prompting and advice of an interviewer, or that people may be more or less likely to give frank responses in the presence of an interviewer.
A wider questionnaire issue is that most official surveys use long questionnaires which can be intolerable when presented on the web, bearing in mind that the respondent may face breaks in connection and other technical problems during the questionnaire. Even with the fairly short APS telephone questionnaire, it might be necessary to trim back to essential questions only.
Any of these effects can lead to bias in the level of the survey estimates and, if the survey is changed or the balance between modes changes, can also bias measures of change over time. In particular, when applied in a longitudinal survey, observed individual change may be confounded with the mode change.
Acknowledging these potential problems with an online survey element, it is necessary in advance to pilot procedures to ensure that a mixed mode system can run smoothly and test questionnaires to design questions less prone to mode effects. In addition, experiments to quantify differences, along the lines of the current comparison of face-to-face and telephone surveys, are required in advance and may be required as an ongoing part of the survey system.
Mobile phone sample
The random digit dialling approach used on the APS is based on activated seven-digit blocks of numbers that are known to have been issued to phone suppliers. As the location of each such block is known, a geographically stratified sample can be drawn. Four digit random numbers are added to the block to complete a potential telephone number which can then be tested to see if that line is in fact live. One person can then be sampled at random from those at the household associated with that line.
The existing APS telephone sample covers only fixed landlines and thus excludes the 15% of households in England that rely on mobile phones alone. One way to address this undercoverage is to run a parallel survey that includes this part of the population, as with the current APS face-to-face parallel study. Alternatively we can attempt to cover the gap using a complementary sample including mobile telephone numbers.
It is possible to use the same basic approach to generate a sample of mobile telephone numbers. The difficulty is in controlling the inclusion in the sample and knowing the probability of each respondent being sampled. The coverage of the landline and mobile RDD samples will have a substantial overlap. To establish the possible routes into the sample for each respondent questions would be needed on the mobile survey on whether there is a fixed landline at home and how many adults share that line and on the landline survey about whether the respondent have an active mobile phone.
An additional related problem is that with a survey of this size, there will be some respondents who are sampled for both parts of the survey.
Mobile numbers are by their nature not associated with an area and so it would be impossible to stratify the sample regionally and in particular to exert the current local authority level control.
In addition to the complexity of the sampling, the mobile sample will likely have a different response rate and response patterns to the landline sample. In particular, the ability to screen callers may lead to such unsolicited calls being blocked. It may also be that the same people answer questions differently when contacted on their mobile phone compared to being contacted at home.
This is clearly an area where substantial development would be needed and methods tested and piloted prior to full implementation.
Appendix: Model-based estimates for local areas and individual sports
The large RDD sample currently employed by the APS is driven by a requirement to produce reasonably precise participation estimates for local authority areas and for a wide variety of sports.
The sample is designed to achieve 500 individual interviews in each local authority in each year so that 1,000 cases are available for analysis every two years. This means that local authorities, which vary widely in size, are sampled at very different rates and this has an impact on the effective sample size for regional and national estimates, reducing the effective sample size by about 30% compared with an equal probability sample.
The following table gives an indication of the precision we should expect at local authority level with an achieved two-year sample of 1,000 individual respondents for a range of different potential levels for an estimate of a proportion. In each case we show the precision as the absolute width of a confidence interval, measured in percentage points, either side of the point estimate and that same width expressed as a proportion of the estimate.
-
Estimate (%)
Conf. Interval ± (Absolute %)
Conf. Interval ± (Relative %)
1
0.7
67%
2
0.9
47%
5
1.5
29%
10
2.0
20%
15
2.4
16%
20
2.7
14%
25
2.9
12%
30
3.1
10%
35
3.2
9%
40
3.3
8%
45
3.4
7%
The standard errors of estimates of sporting participation rates and total number of participants are smaller for less popular sports. However the relative standard errors, as a percentage of the estimated rates or totals, are larger for the sports with fewer participants. The APS currently uses a rule that sports participation estimates are reported where 30 or more participants are identified in the survey but are considering a proposal to change this criterion to 75 participants. Taking into account the oversampling by local authority and sampling one person per household, this 75 participant criterion equates to a relative standard error of about 15% of the estimate6.
The reduced sample sizes considered in the two options will lead to larger standard errors than the current survey, although there should be other quality benefits in terms of bias and coherence. The exclusively face-to-face option A is too small for direct local authority estimates. Under option B, the telephone sample is reduced to 130,000 interviews, or approximately 800 per local authority over two years. Taken together with the face-to-face sample in option B, this would recover virtually the same sample sizes as at present; although we will need to investigate how best to integrate these sources once we have more information from the current face-to-face APS study. Smaller sample sizes would also lead to fewer sports meeting the relative standard error criterion.
In place of direct estimation, we can explore alternatives of model-based estimates. These are estimates that rely on an assumption that the data follow a statistical model. Under this assumption about the model, the standard errors of the estimates are smaller.
Small area estimates
For small area estimates, we can apply a statistical model that links participation rates in an area to other known characteristics of the area. Modelling techniques are used to fit that model to the observed data and the resulting model used to predict participation rates for all areas. Modelling for small area estimates has already been applied to existing APS data to estimate participation rates for MSOAs7. Using a comprehensive range of MSOA-level predictors from the Census, Recorded Crime, Benefits and other administrative data, the models explained respectively 85% and 75% of the between-MSOA variance in the key NI8 and One Million survey estimates. Consequently, when compared with potential direct MSOA estimates, the average width of the confidence/credible8 intervals for these estimates fell from 24.5% to 5.1% for the NI8 estimates and from 20.5% to 4.4% for the One Million estimates.
To illustrate the different uses of small area estimation in official statistics, we include below two case studies.
Example: Model based estimates of unemployment for small areas, ONS
Data from the Annual Population Survey are used to produce estimates of total unemployment and unemployment rates for local and unitary authorities in Great Britain, broken down into broad age groups (16-24, 25-49 and 50+) by sex. These are rolling annual estimates, produced quarterly. The Labour Force Survey, on which the Annual Population Survey is based, uses a single-stage sample of addresses with addresses remaining in the sample for five consecutive quarters but this annual analysis makes use of first and fifth interviews so that no sampled address will appear in the data more than once. Sample boosts are added to provide minimum sample sizes at local authority level. This provided 230,000 individual responses in England for the year October 2010 to September 2011.
The local-authority level model includes covariates for age group and sex, region, Area classification cluster and the claimant count in various forms. The model includes an area random effect term which means that each LA estimate can be seen as a weighted average of a fixed effects model estimate and a direct estimate, which guarantees that its precision will be no worse than either of those. Local authority totals are constrained to add to regional totals to ensure coherence with other outputs.
The model based estimates lag behind the standard LFS outputs, so for example in mid April 2012, the ONS reported on national and regional LFS results up to the December 2011 to February 2012 quarter, with model-based unemployment estimates up to the October 2010 to September 2011 year. Plans are in place to reduce this lag by accelerating the production of the Annual Population Survey.
The estimates are provided with a confidence interval. The average coefficient of variation for recent local authority unemployment totals is 11 per cent of the total. User guidance advises caution when interpreting differences in the estimates over time as a measure of change, but does go on to give advice on how to make such comparisons and estimate the standard error of the change.
The introduction of Universal Credit from October 2013 means that the Claimant Count will no longer be available in its current form. The ONS is planning how to handle this change to this major input into the model.
Example: Small Area Income Estimates for England and Wales, ONS
These are estimates of average household income, defined in four different ways, at the middle-level super output area (MSOA), produced every three years, most recently for 2007/08. The estimates are modelled using data from the Family Resources Survey which employs a two-stage sample of addresses. These are designated as experimental statistics.
Because of the clustered nature of the FRS, no direct estimates are available for the vast majority of MSOAs, so a modelled approach is the only option. The model is built using only those areas with some sample and then applied to all areas because the covariates in the model are available for all areas – a process called synthetic estimation. After variable selection, the four models include the region, variables from the Census, take up of pension and tax credits and of disability living allowance, Council Tax distribution and information about change of ownership. The estimates are constrained to add to direct estimates from the FRS at regional level.
The estimates are provided together with confidence intervals at the MSOA level, but not at the local authority level. The guidance states that each set of estimates has been produced as the best estimates at that point in time but that the difference between estimates over time should not be used as a measure of change.
The examples above show that model-based estimates are used for official statistics. However, the main emphasis in each case is to provide a descriptive analysis at a point in time. For each area, the modelled estimates make a prediction for an area with such characteristics. The problem here is that if a particular local authority makes an exceptional local effort locally to promote sport, the benefits may not be attributed to that particular local authority, but smoothed over similar authorities.
There are two ways in which such a local change of this kind would be attributed to that local authority. Firstly, it may be that the nature of the effort is directly recorded in the characteristics of the authority. For example, if the extra effort is through extra targeted expenditure and that local expenditure is used as one of the variables in the model (recorded in a consistent manner across all local authorities) then we would expect to find that extra expenditure to be positively associated with increased participation. Then any individual local authority making that extra expenditure will show an increase in participation in their modelled estimates. However, no such characteristic has thus far been identified so it is not clear without further investigation whether this will work.
Secondly, the predictions from a small area model can be based on a simple estimator based only on the fixed effects in the model or can use a more complex prediction that includes an estimate of the local area random effect. Such estimates of local random effects are ‘shrunken’ in the sense that they will be more influenced by the local data if the local sample sizes are larger, so we would expect to see local effects where the local sample sizes are substantial. We see this with the local-area unemployment estimates.
The production of such modelled estimates is necessarily more complex than the present analysis. Currently, bespoke analyses for local authorities can be produced, albeit limited by local sample size, and because the same estimation process is used throughout, these analyses will be coherent with the national estimates with, for example, the sum of local participants added to the regional and then national totals.
Estimates for individual sports
Estimates for individual sports (and any other survey estimates) can also benefit from a modelled or model-assisted approach to estimation, although we have not found a technique that would give the same sort of improvement as for small-area estimates.
The usual approach is to model participation in a sport against a range of individual-level factors, such as demographic indicators and then to use that model with known population distributions of those factors to obtain a regression estimate for the population. In fact, this approach would lead to the same outcomes as estimates that use calibrated weights. The precision benefits are strongest when the model has a high explanatory power for the outcome variables, sporting participation in this case.
This calibration approach requires population distributions for the covariates used in the model. These do not have to be fixed distributions, they can be estimates from other survey sources, but if so the precision benefits will be reduced. In fact, if the estimated population distributions are too variable then this modelled estimator could have a higher variance than a non-calibrated estimate.
It may be possible, from joint modelling of different sports with correlated patterns of participation amongst different groups in the population. From a brief review of techniques, we have not seen a similar application in use. If we were to derive such a method, the improved precision would be at the cost of relying on a model of the joint participation in sports. As with local estimates, such a model may be insensitive to a concerted effort to promote one sport which is not pursued in an associated sport. However, we have yet to identify a technique to put such an approach into practice.
1 Active People Survey – Mobile Omnibus research 2011, TNS-BMRB, July 2011
2 The APS is introduced in a neutral way to attempt to minimise selection bias from interest in the survey topic.
3 Post 2009 reorganisation
4 Excluding the Isles of Scilly UA and City of London
5 The Application of alternative modes of data collection in UK government social surveys, Betts and Lound (2010) http://tinyurl.com/gssmodes
6 The relationship between the interviewed number of participants and relative standard error at the cut-off point will change if the sample design is changed.
7 Active People Survey APS3-APS4, Small area estimates, Ipsos MORI, August 2011.
8 The modelling approach uses a Bayesian approach to create credible intervals analogous to confidence intervals in design-based estimation.
17 FOR DISCUSSION PURPOSES ONLY CREATED ON 8222006 53100
2007_WMSCI_Academic_Globalization_discussion-166f287
2018 IFB® YOUNG LEADER DISCUSSION MEETS I WHAT IS
Tags: active people, 7 active, discussion, people, active, options, taking
- SEU NOME COMPELTO MEUEMAILGMAILCOM MOBILE 0400 320 001 2355
- UNIVERSITY OF VIRGINIA VICE PRESIDENT’S OFFICE FOR RESEARCH POST
- [YOUR LOGO GOES HERE] DRIVETHROUGH CLINIC FOR MEDICATION OR
- LP OBSZAR DZIAŁAŃ ZADANIA DO REALIZACJI ODBIORCY WSKAŹNIKI 1
- SENDING MAIL WITH ATTACHMENT INLINE IMAGE USING NET THIS
- SPORTS COLLECTIFS CITOYENNETE INTERVENANTS MATIN JC THOMAS
- THE LINKS BELOW OPEN THE ADDITIONAL CASE STUDIES AND
- VLADA REPUBLIKE HRVATSKE ZAGREB 21 LISTOPADA 2021 PREDLAGATELJ
- UNA COMUNIDAD PUEDE POR EJEMPLO PROPONERSE UNA CAMPAÑA DE
- THE INDIAN JOURNAL OF PATHOLOGY & MICROBIOLOGY (INDEXED AS
- YORKSHIRE HISTORIC CHURCHES TRUST LIST OF GRANT MAKING BODIES
- LUIS MARTÍN VALDIVIEZO ARISTA UNIVERSIDAD DE MASSACHUSETTSESCUELA DE EDUCACIÓN
- SOLICITUD CLASE MAGISTRAL CLASE MAGISTRAL CON DIEGO MONTOYA LUGAR
- L DT VELKÉ SKALINY WWWVELKESKALINYCZ INFORMACE PRO RODIČE NAŠE
- (APARTADO MEMORIA JUSTIFICATIVA) 321 ACCESOADMISIÓN 321REQUISITOS DE ACCESO Y
- CONVENTION DEPARTEMENTALE 06 DSDENCOMITE DEPARTEMENTALUSEP RÉFÉRENCES
- 3 FROM THE INTEGRATED FRAMEWORK TO THE ENHANCED INTEGRATED
- TSV JALKAPALLO KUUTONEN SARJATILANNE ITÄLOHKO (SARJATILANNE 07082016) JOUKKUE P
- 9PROGRAMA Y PROFESORADO IMPLICADOINMIGRACIÓN Y DESARROLLO EN ÁMBITOS LOCALES
- ÖĞRENCİ İŞLERİ BİRİMİ GÖREV TANIMI BIRIM SAĞLIK YÜKSEKOKULU ÖĞRENCI
- MAGYAR HONVÉDSÉG BUDAPEST FŐVÁROSI HADKIEGÉSZÍTŐ PARANCSNOKSÁG TISZTELT IGAZGATÓ
- PEDAGÓGIA A CSALÁDI NEVELÉS TÍPUSAI ÉS AZOK HATÁSAI A
- APARTADO DE LÉXICO (CF BLOQUE A) DESCUBRE LAS PALABRAS
- LEY Y DECRETOS QUE RIGEN EL TRABAJO DE LAS
- RESPECT DISCUSSION QUESTIONS NAME HOUR RESPOND TO EACH QUESTION
- ABMACHUNGEN EINER RICHTERVERPFLICHTUNG ZWISCHEN EINEM FCIAUSSTELLUNGSRICHTER UND EINEM FCIAUSSTELLUNGSVERANSTALTER
- VERSION FINAL (16 3 16) COSTS ASSESSMENT RULES COMMITTEE
- EDUCATION HUMAN RESOURCES WHISTLEBLOWING POLICY FOR SCHOOL STAFF SEPTEMBER
- ENTE NAZIONALE PER L’AVIAZIONE CIVILE AUTORITÀ COMPETENTE DELLA REPUBBLICA
- RJEŠENJE O IZBORU MANDATNOG POVJERENSTVA OPĆINSKOG VIJEĆA OPĆINE MATULJI
 P WIELKOPOLSKI KOMENDANT WOJEWÓDZKI POLICJI W POZNANIU OZNAŃ 21042015
15080853000NAN IEEE P80215 WIRELESS PERSONAL AREA NETWORKS PROJECT IEEE
 A UTOMOBILKLUB WIELKOPOLSKI TOR „POZNAŃ” UL WYŚCIGOWA 3 62081
Ðïࡱáþÿ ¥á+ð¿bjbj²â²â4ð¨dhð¨dhÿÿÿÿÿÿ·x9ex9ex9ex9ex9eÿÿÿÿ²²²²î²x9c®êêêêêùùù÷ùùùùùùj¶n9x9eùùùùùx9ex9eêêïvù x9eêx9eê÷ù÷êÿÿÿÿýøÿÿÿÿããl0x9cnnnx9ex93pùùùùùùùeù
 POWERPLUSWATERMARKOBJECT3 LOS CINCO SENTIDOS CAMPAMENTO SEMANA SANTA ADYC DEL
 ITUDRPMEUR0912S PÁGINA 3 SECTOR DE DESARROLLO DE LAS TELECOMUNICACIONES
 Hotel Meliá Bilbao Lehendakari Leizaola 29 48001
 MULTIPLE CHOICE QUESTIONS (MCQ) TOPIC QUIZ 51 RATES
 THE INTERPERSONAL PSYCHOTHERAPY COURSE INTRODUCTION INTERPERSONAL THERAPY (IPT) IS
 ANEXO-I
KAIP AUGA VAIKELIS TAVO ĮSČIOSE BIOLOGINIU POŽIŪRIU ŽMOGAUS VYSTYMASIS
 N4F3 ARREDONIR NOMBRES NATURALS NOM I COGNOMS DATA
145 REVISED 62016 ACCOUNTING PRINCIPLES AND STANDARDS HANDBOOK CHAPTER
CV EVA GARCIA PEREA DNI 11827474T DIPLOMA EN ENFERMERÍA
OPĆI PODACI O DRUŠTVU OBRASCI 11OPGF NAZIV DRUŠTVA ADRESA
CLASSIFICATIONSALARY RANGE REVIEW REQUEST (TO BE COMPLETED BY REQUESTING
 WNIOSEK O PRZYZNANIE ŚWIADCZENIA POMOCY MATERIALNEJ O CHARAKTERZE SOCJALNYM
 DOCUMENTO DE CONTROL DE CAMBIOS Y VERSIONES DEL SAIC
GEOGRAPHY 345 SPRING 2003 ESSAY SCORING GUIDE NOTE THIS
LOCAL TV REVIEW COMMERCIALLY VIABLE LOCAL TELEVISION IN THE
