INTEGRATED SEASONAL CLIMATE FORECASTS FOR SOUTH AMERICA CAIO A
(ENTER SCHOOL DISTRICT NAME) INTEGRATED PEST MANAGEMENT SERVICE AGREEMENT1232008 INTEGRATED COMMUNITY SERVICE PARTNERSHIPS SITE APPLICATION DESCRIPTION
13 THE INTEGRATED POVERTY REDUCTION STRATEGY FOR THE WESTERN
2.3%20Integrated%20Pest%20Management%20and%20Forest%20Health%208-5-05
25 INTEGRATED NUTRIENT MANAGEMENT FOR MORE SUSTAINABLE CASSAVA PRODUCTION
3 FROM THE INTEGRATED FRAMEWORK TO THE ENHANCED INTEGRATED
5A
Integrated seasonal climate forecasts for South America
Caio
A. S. Coelho1,
David B. Stephenson2,
Francisco J. Doblas-Reyes3,
Magdalena Balmaseda3
and Richard Graham4
1Centro
de Previsão de Tempo e Estudos Climáticos (CPTEC),
Instituto Nacional de Pesquisas Espaciais (INPE), Cachoeira Paulista,
Brazil.
2School of Engineering, Computing and Mathematics, University of Exeter, Exeter, U.K.
3European Centre for Medium-Range Weather Forecasts (ECMWF), Reading, U.K.
4Met Office, Exeter, U.K.
Corresponding author: [email protected]
INTRODUCTION
South
America seasonal climate forecasts are currently produced using
empirical (statistical) and dynamical (physical) models. Given the
availability of these two modelling approaches one might question
the feasibility of producing a single and well calibrated integrated
forecast that gathers all available information at the time the
forecast is issued. This study illustrates how empirical and
dynamical coupled model precipitation seasonal forecasts for South
America are currently being integrated (i.e. combined and
calibrated) in EUROBRISA (A EURO-BRazilian Initiative for improving
South American seasonal forecasts,
http://www.cptec.inpe.br/~caio/EUROBRISA). The skill of one month
lead austral winter (June-July-August) forecasts is
assessed and discussed.
METHODOLOGY
One of the simplest empirical approaches to produce one-month lead austral winter (June-July-August) South America precipitation forecasts use as predictor variable Pacific and Atlantic sea surface temperatures observed in the previous April. This multivariate regression model (Coelho et al. 2006) is used here to produce empirical precipitation forecasts for South America.
The dynamical systems used in this study to produce one-month lead precipitation forecasts for June-July-August are the coupled ocean-atmosphere seasonal prediction models of ECMWF (Anderson et al. 2007), known as System 3, and the UK Met Office (UKMO; Graham et al. 2005), known as GloSea. The forecast output from these models is coordinated at ECMWF as part of the European Seasonal to Inter-annual Prediction project (EUROSIP).
To produce empirical-dynamical multi-model integrated probabilistic forecasts we apply a Bayesian procedure, known as forecast assimilation (Stephenson et al. 2005). This procedure allows the spatial calibration and combination of forecasts produced by each individual model. The skill of empirical, ECMWF, UKMO and integrated forecasts obtained with forecast assimilation is assessed and compared over the common hindcasts period 1987-2001. All results were obtained using the cross-validation method (Wilks 1995). Forecast verification is performed using the version 2 Global Precipitation Climatology Project (GPCP) monthly precipitation analysis (Adler et al. 2003).
RESULTS AND DISCUSSION
Figure 1a-d shows correlation maps of ECMWF, UKMO, empirical and integrated precipitation anomaly forecasts for the period 1987–2001. Correlation maps show the correlation between observed and mean forecast anomalies at each grid point. Both ECMWF and UKMO forecasts are bias corrected because we are dealing with ensemble mean forecast anomalies with respect to each model climatology. The three individual models show high skill with correlation coefficients generally between 0.4 and 0.8 in tropical South America. ECMWF, UKMO and empirical forecasts are moderately skilful over the south of Brazil and southeast Argentina with correlation coefficients between 0.2 and 0.6. Empirical forecasts also show moderate skill over Bolivia with correlation coefficients between 0.4 and 0.6. When the forecasts of the three individual models was combined and calibrated to produce integrated forecasts, improved skill was obtained over tropical and southeast South America (Fig. 1d).
Correlation is a deterministic measure of skill that indicates how well associated the forecast is with the corresponding observed anomaly. Correlation, however, only assesses the mean forecast value. In order to assess how well forecast uncertainty is estimated, one needs for example to examine probabilistic scores. Here we examine Gerrity (1992) score maps for tercile probability categories (Figs 1e-h). Tercile categories are defined as below normal, normal and above normal according to the climatological June-July-August precipitation distribution. Large values of Gerrity score indicate increasing correspondence between the category that was forecast as most likely and the category that was observed. In accordance with the correlation map (Fig 1d), integrated forecasts (Fig 1h) have improved (higher) skill in tropical and southeast South America when compared to the three individual forecasts (Figs. 1e-g). This result indicates that not only the estimate of the mean forecast value is improved by calibration and combination of empirical and coupled model forecasts. Uncertainty estimates are also improved by calibration and combination.
Figure 2 shows austral winter 1987–2001 precipitation anomaly forecasts for a grid point in southeast South America (longitude 297.5o; latitude -37.5o) produced by ECMWF, UKMO, empirical and integrated (combined and calibrated) with forecast assimilation. The 95% prediction interval (grey shading) is given by the mean forecast value plus or minus 1.96 times the forecast standard deviation. ECMWF and UKMO forecast standard deviation (i.e. the spread) is computed as the standard deviation of the ensemble members of each model. Empirical and integrated forecast standard deviation is computed as described in Coelho et al. (2006) and Stephenson et al. (2005), respectively, and posteriorly re-scaled to match the mean forecast error. Figure 2 shows that all four forecasting approaches produce reliable forecast uncertainty estimates, with most observations falling inside the 95% prediction intervals. ECMWF and UKMO have larger 95% prediction intervals than empirical and integrated forecasts. Integrated forecasts are well calibrated showing the best agreement between the mean forecast value and the observed anomalies (Fig 2d). Integrated forecasts have the largest amount of interannual variability. This is also reflected in the highest correlation between integrated forecast and observed anomalies. The correlation coefficients between forecast and observed anomalies for ECMWF, UKMO, empirical and integrated forecasts are 0.42, 0.44, 0.56 and 0.65, respectively.
CONCLUSIONS
This study has examined the skill of austral winter seasonal forecasts for South America produced by two coupled ocean-atmosphere models, an empirical model and integrated (i.e. combined and calibrated) forecasts. The main findings can be summarised as follows:
forecast skill can be improved by calibration and combination;
the availability of forecasts produced by both empirical and coupled models provide the opportunity to produce objectively integrated, in other words, combined and well calibrated probabilistic forecasts that gather all available information at the time the forecast is issued;
austral winter precipitation forecasts produced by the empirical-dynamical multi-model integrated system presented here are skilful in tropical and southeast South America.
integrated forecasts generally provide skill that is equal to or better than that of the best individual model
ACKNOWLEDGMENTS
CASC was sponsored by Fundação de Amparo à Pesquisa do Estado de São Paulo (FAPESP), processes number 2005/05210-7 and 2006/02497-6. We thank ECMWF and the UK Met Office for providing the hindcast data.
REFERENCES
Adler, R.F., G.J. Huffman, A. Chang, R. Ferraro, P. Xie, J. Janowiak, B. Rudolf, U. Schneider, S. Curtis, D. Bolvin, A. Gruber, J. Susskind, P. Arkin, 2003: The Version 2 Global Precipitation Climatology Project (GPCP) Monthly Precipitation Analysis (1979-Present). J. Hydrometeor., 4,1147-1167.
Anderson, D., T. Stockdale, M. Balmaseda, L. Ferranti, F. Vitart, F. Molteni, F. J. Doblas-Reyes, K. Mogensen and A. Vidard, 2007. Development of the ECMWF seasonal forecast System 3. ECMWF Technical Memorandum, 503, pp 56 [Available from http://www.ecmwf.int/publications/library/do/references/show?id=87744].
Coelho C.A.S., D. B. Stephenson, M. Balmaseda, F. J. Doblas-Reyes and G. J. van Oldenborgh, 2006: Towards an integrated seasonal forecasting system for South America. J. Climate , 19, 3704-3721.
Gerrity, J.P., 1992, A Note on Gandin and Murphy's Equitable Skill Score. Monthly Weather Review, 120, 2709-2712.
Graham, R.J., M. Gordon, P. J. McLean, , S. Ineson, M. R. Huddleston, M. K. Davey, A. Brookshaw and R.T.H. Barnes, 2005: A performance comparison of coupled and uncoupled versions of the Met Office seasonal prediction General Circulation Model. Tellus, 57A, 320-339.
Stephenson, D. B., Coelho, C. A. S., Doblas-Reyes, F.J. and Balmaseda, M., 2005: Forecast Assimilation: A Unified Framework for the Combination of Multi-Model Weather and Climate Predictions. Tellus, 57A, 253-264.
Wilks, D. S., 1995: Statistical methods in atmospheric sciences: An introduction. 1st Edition. Academic Press. 467pp.
|
|
|
|
|
|
|
|
|
|
|
|
|||
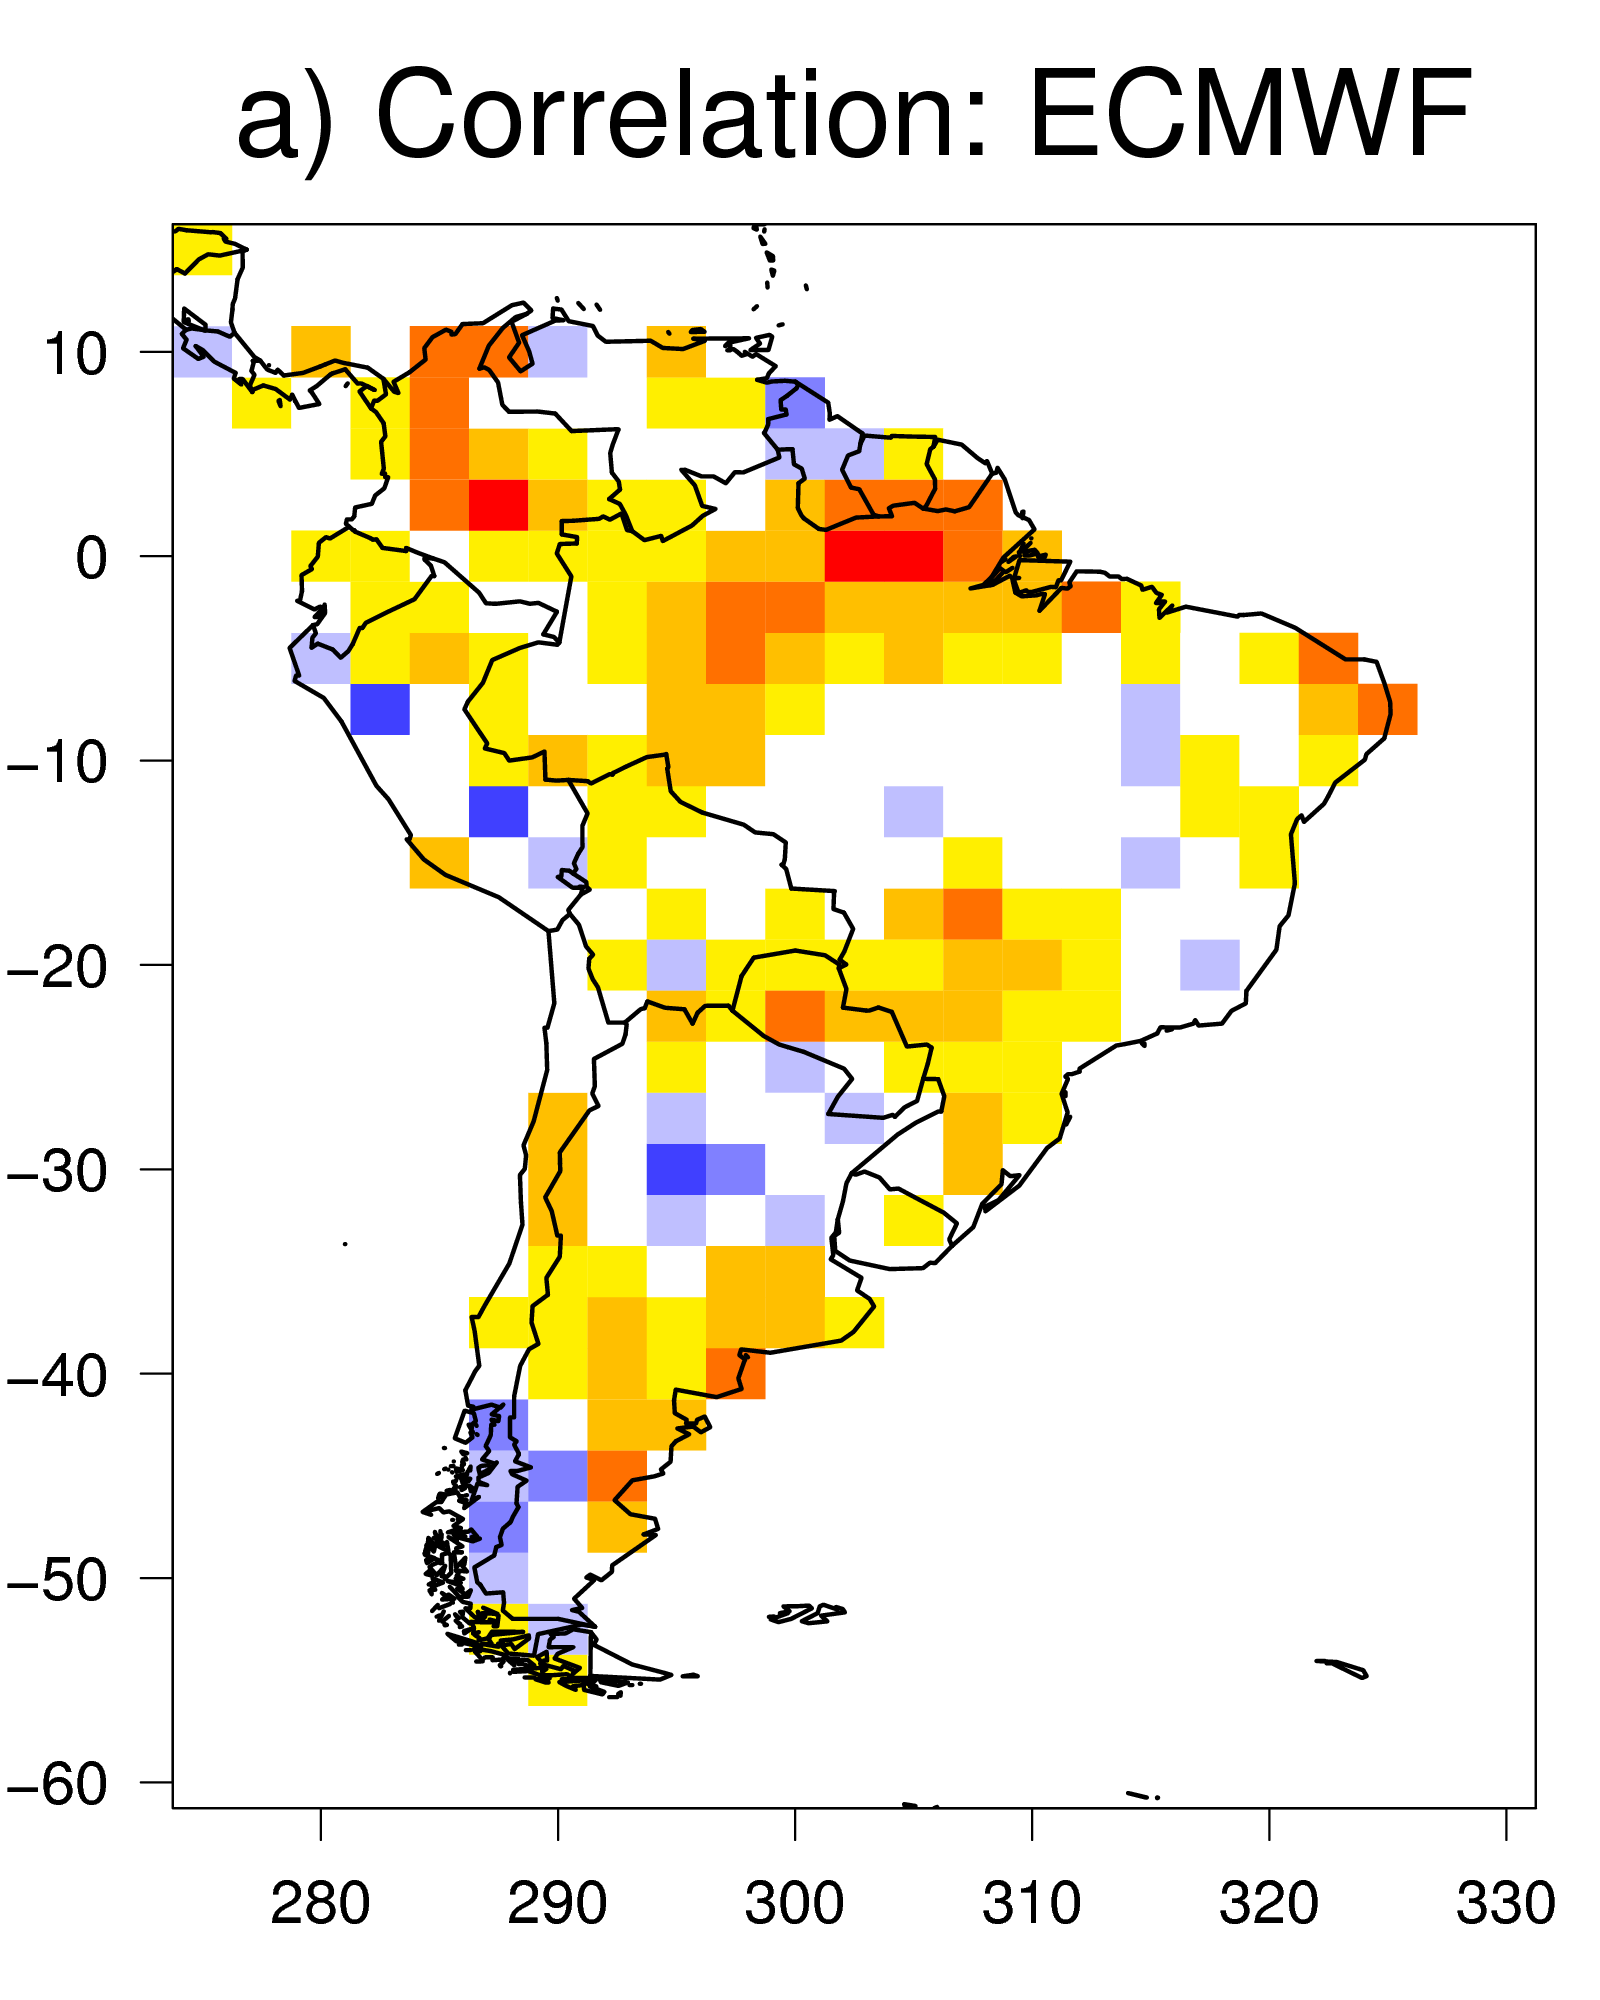
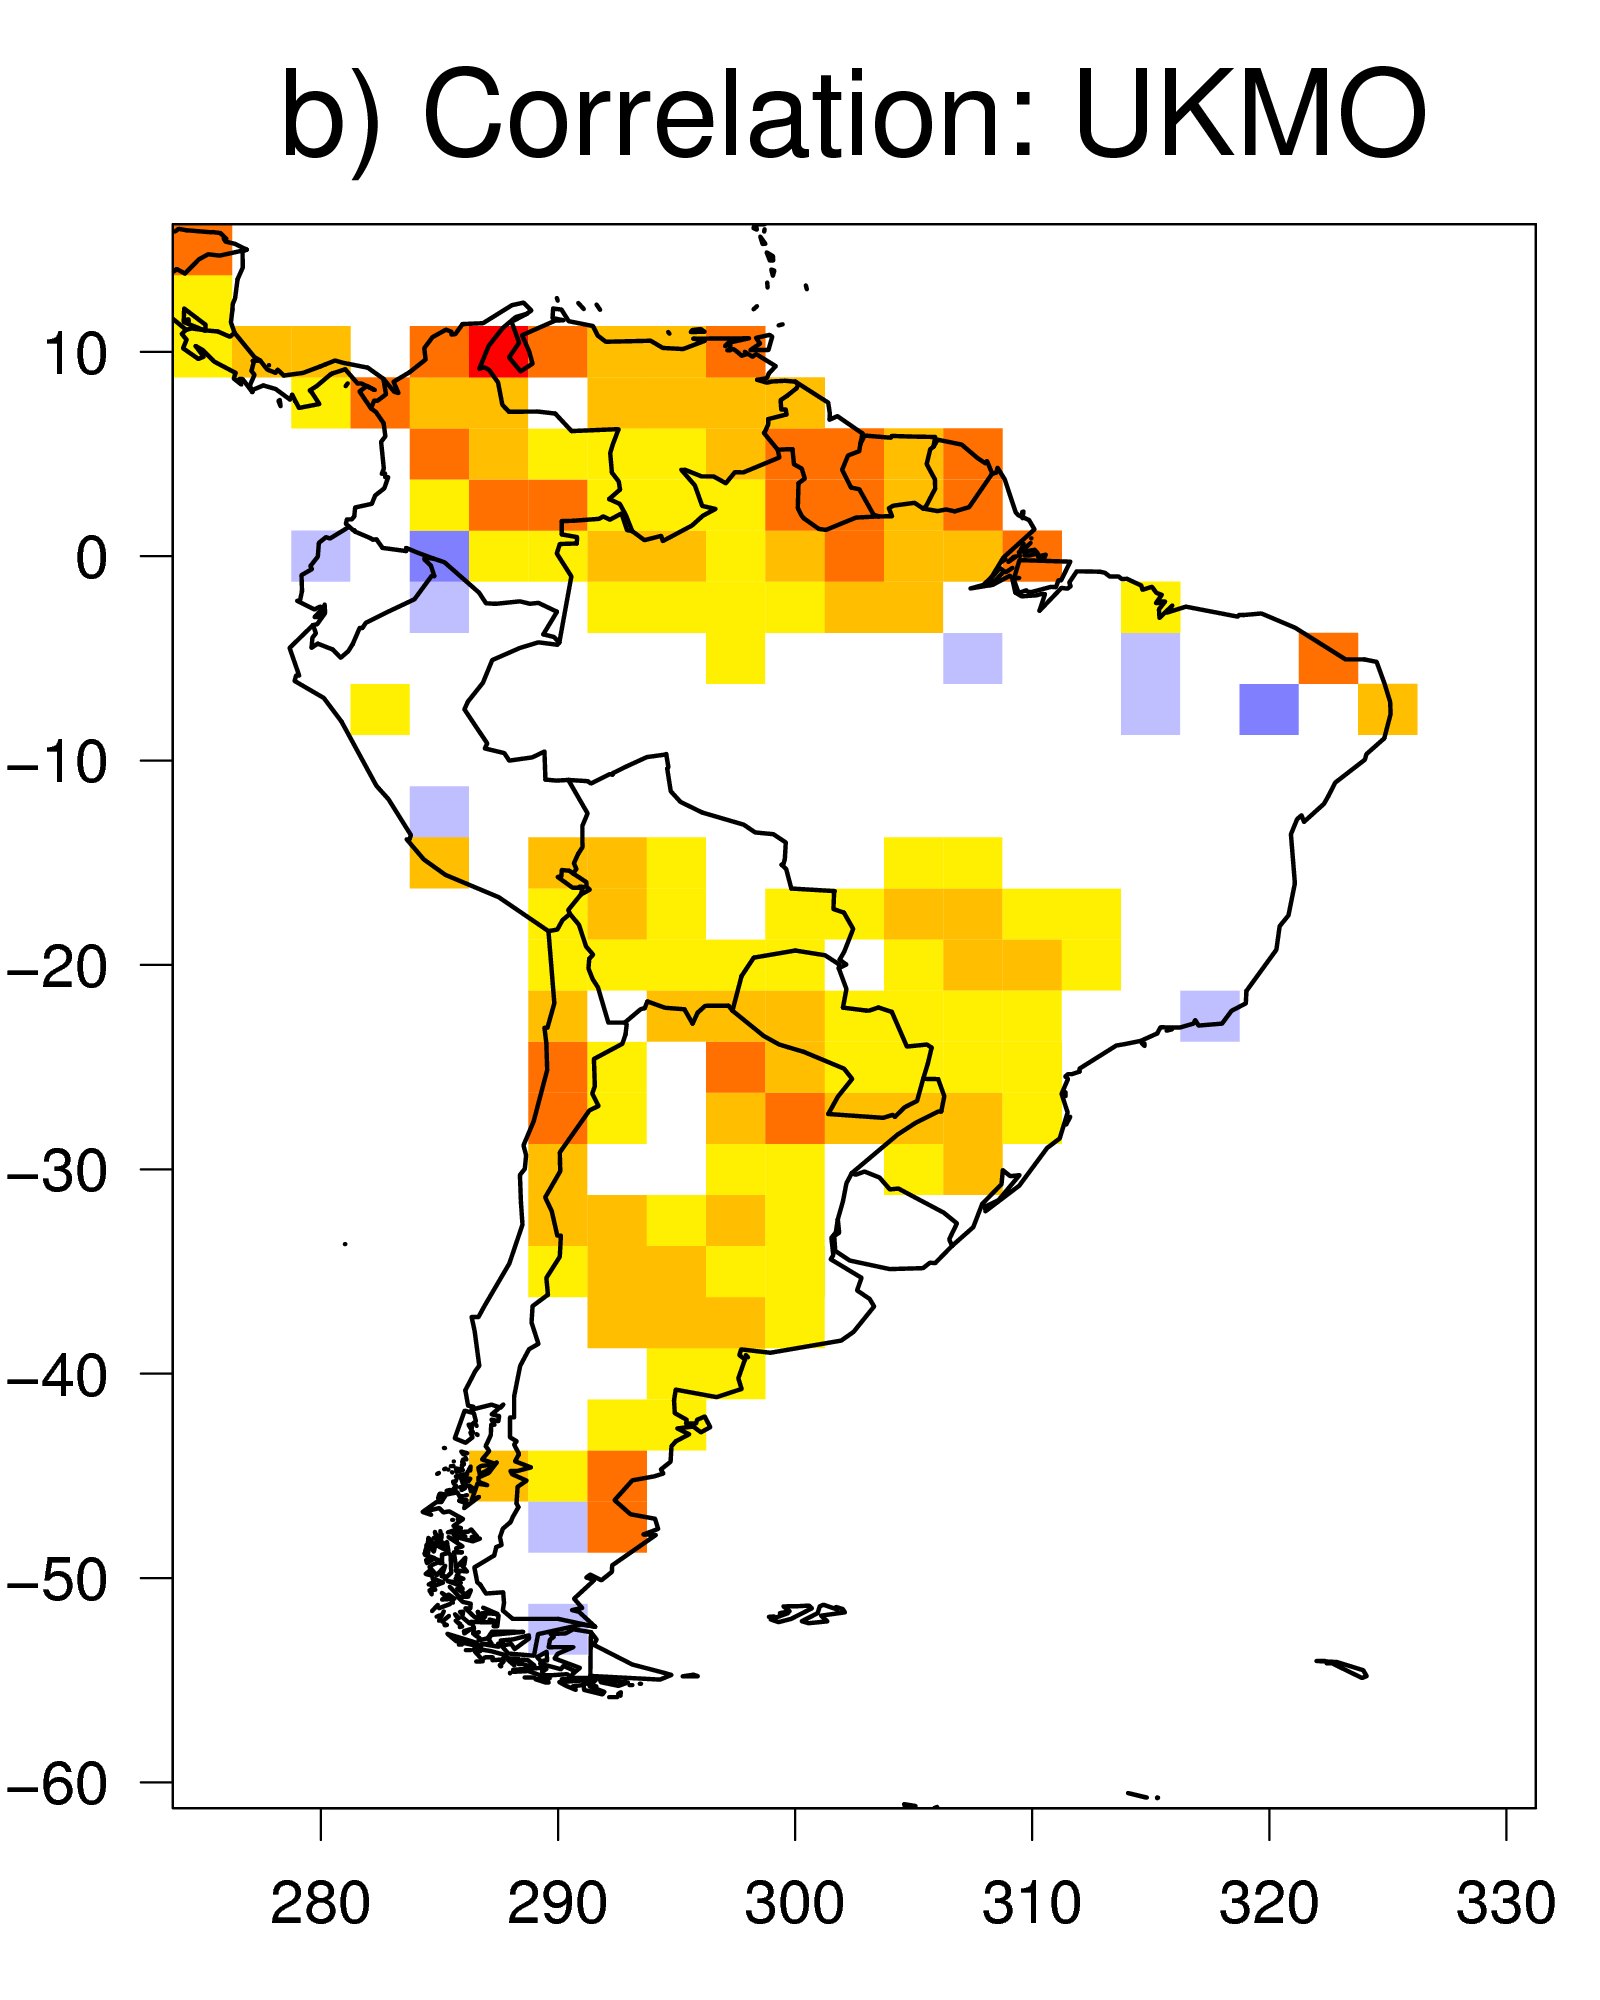
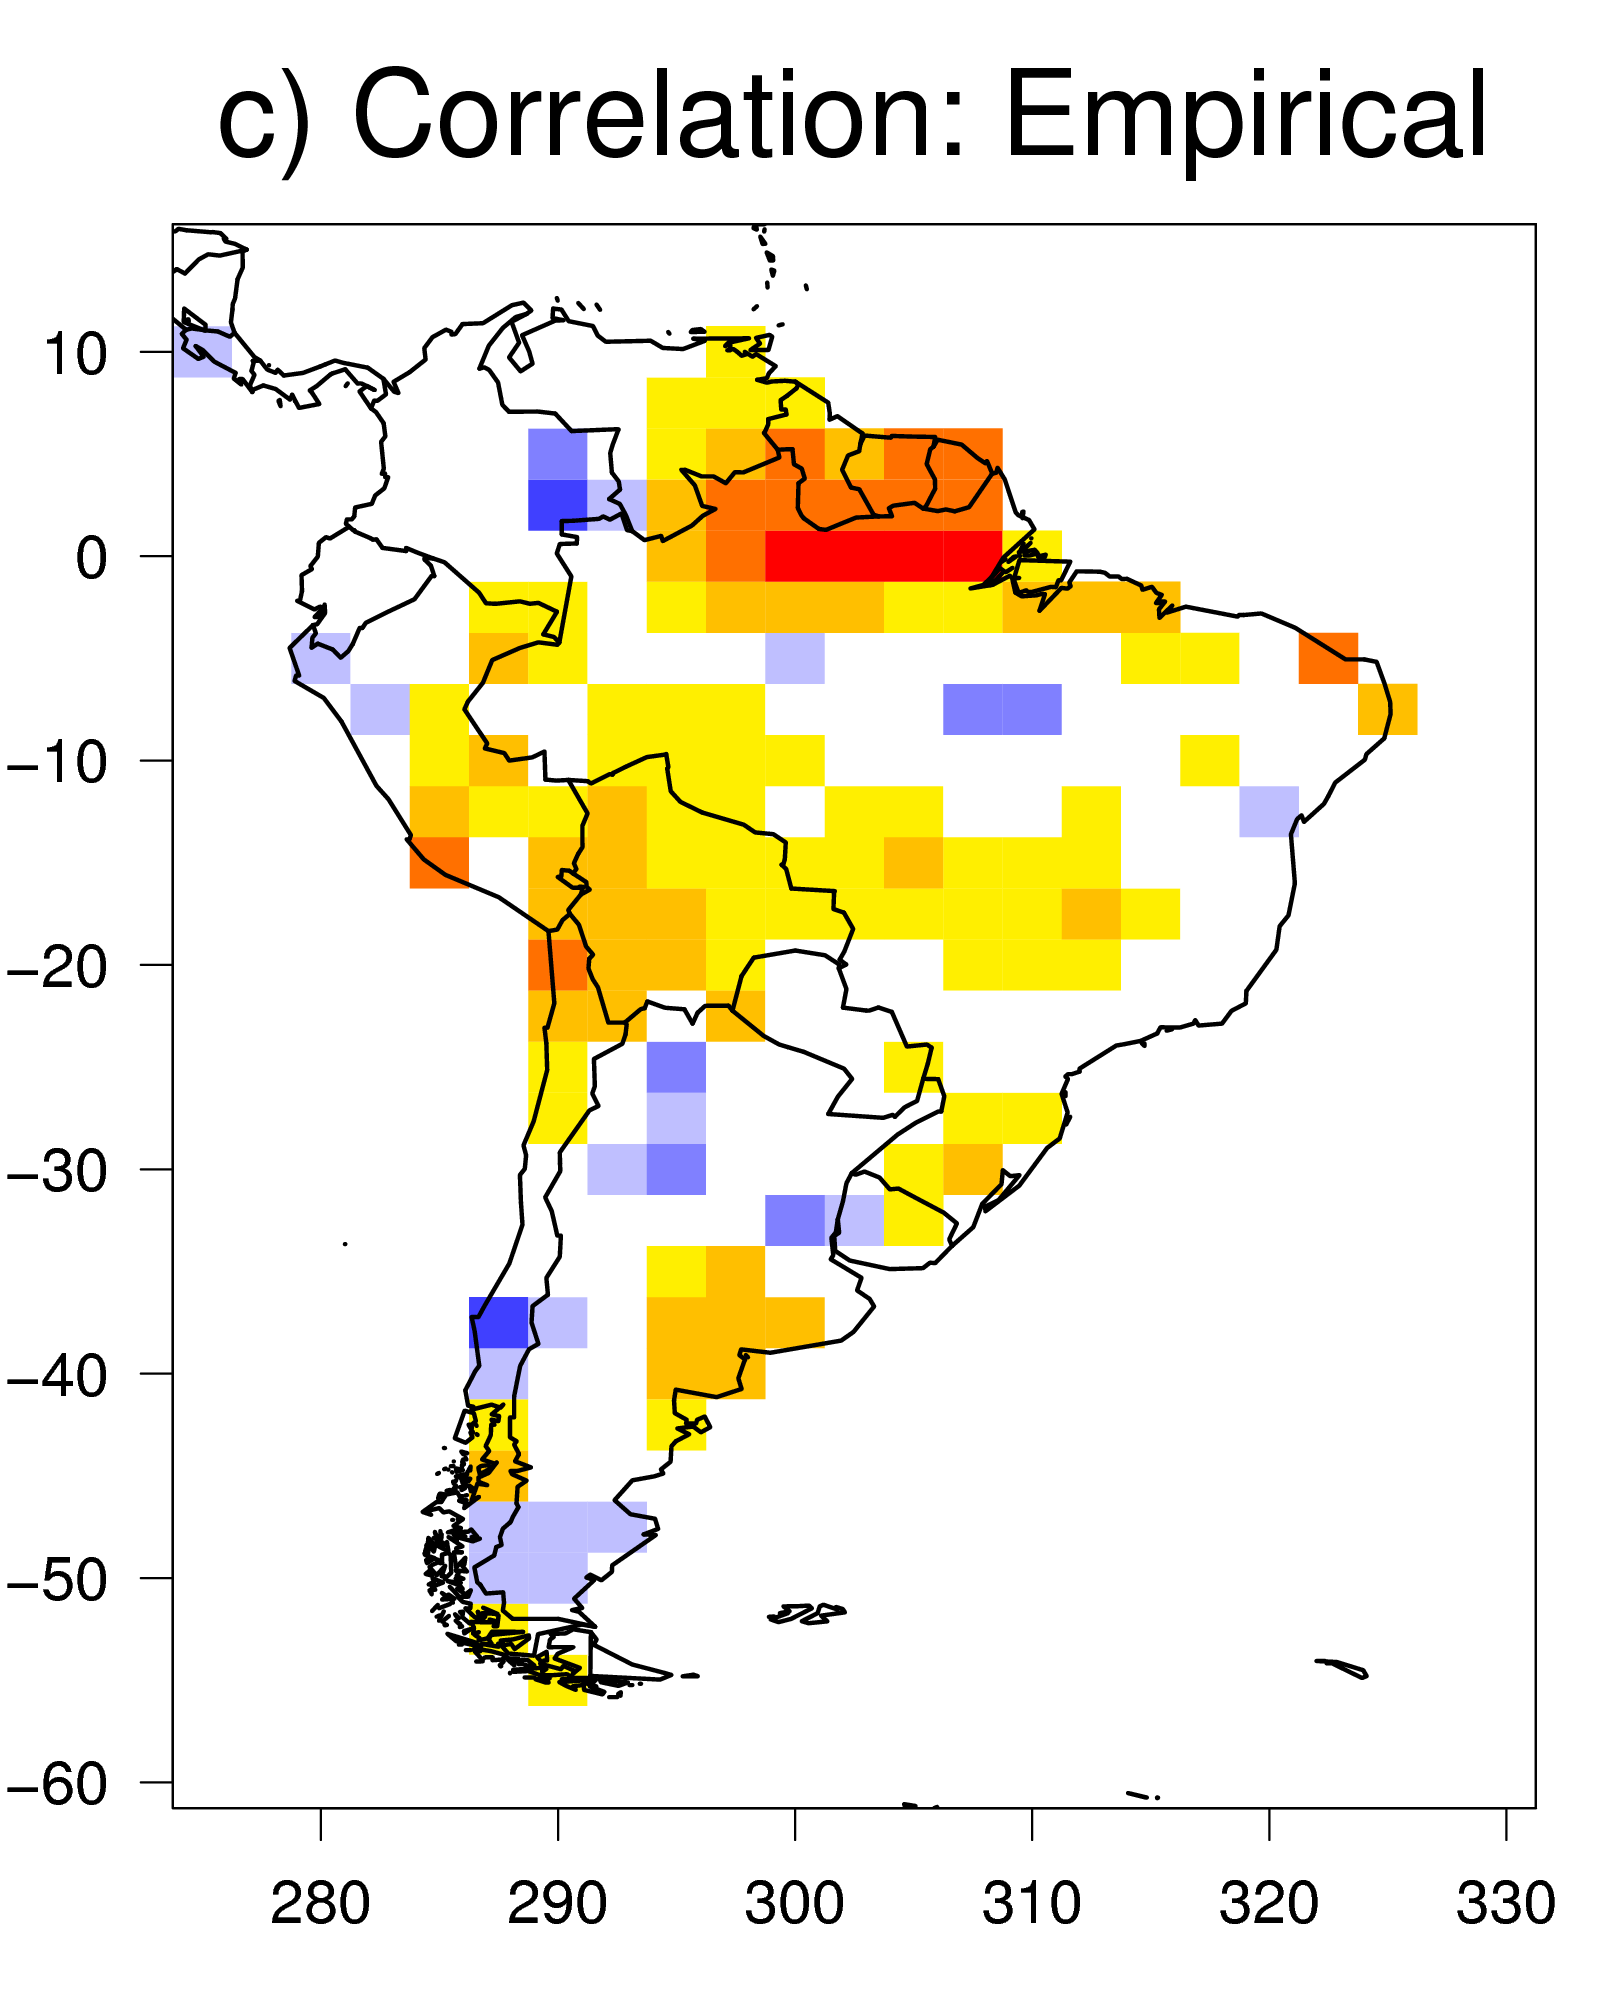
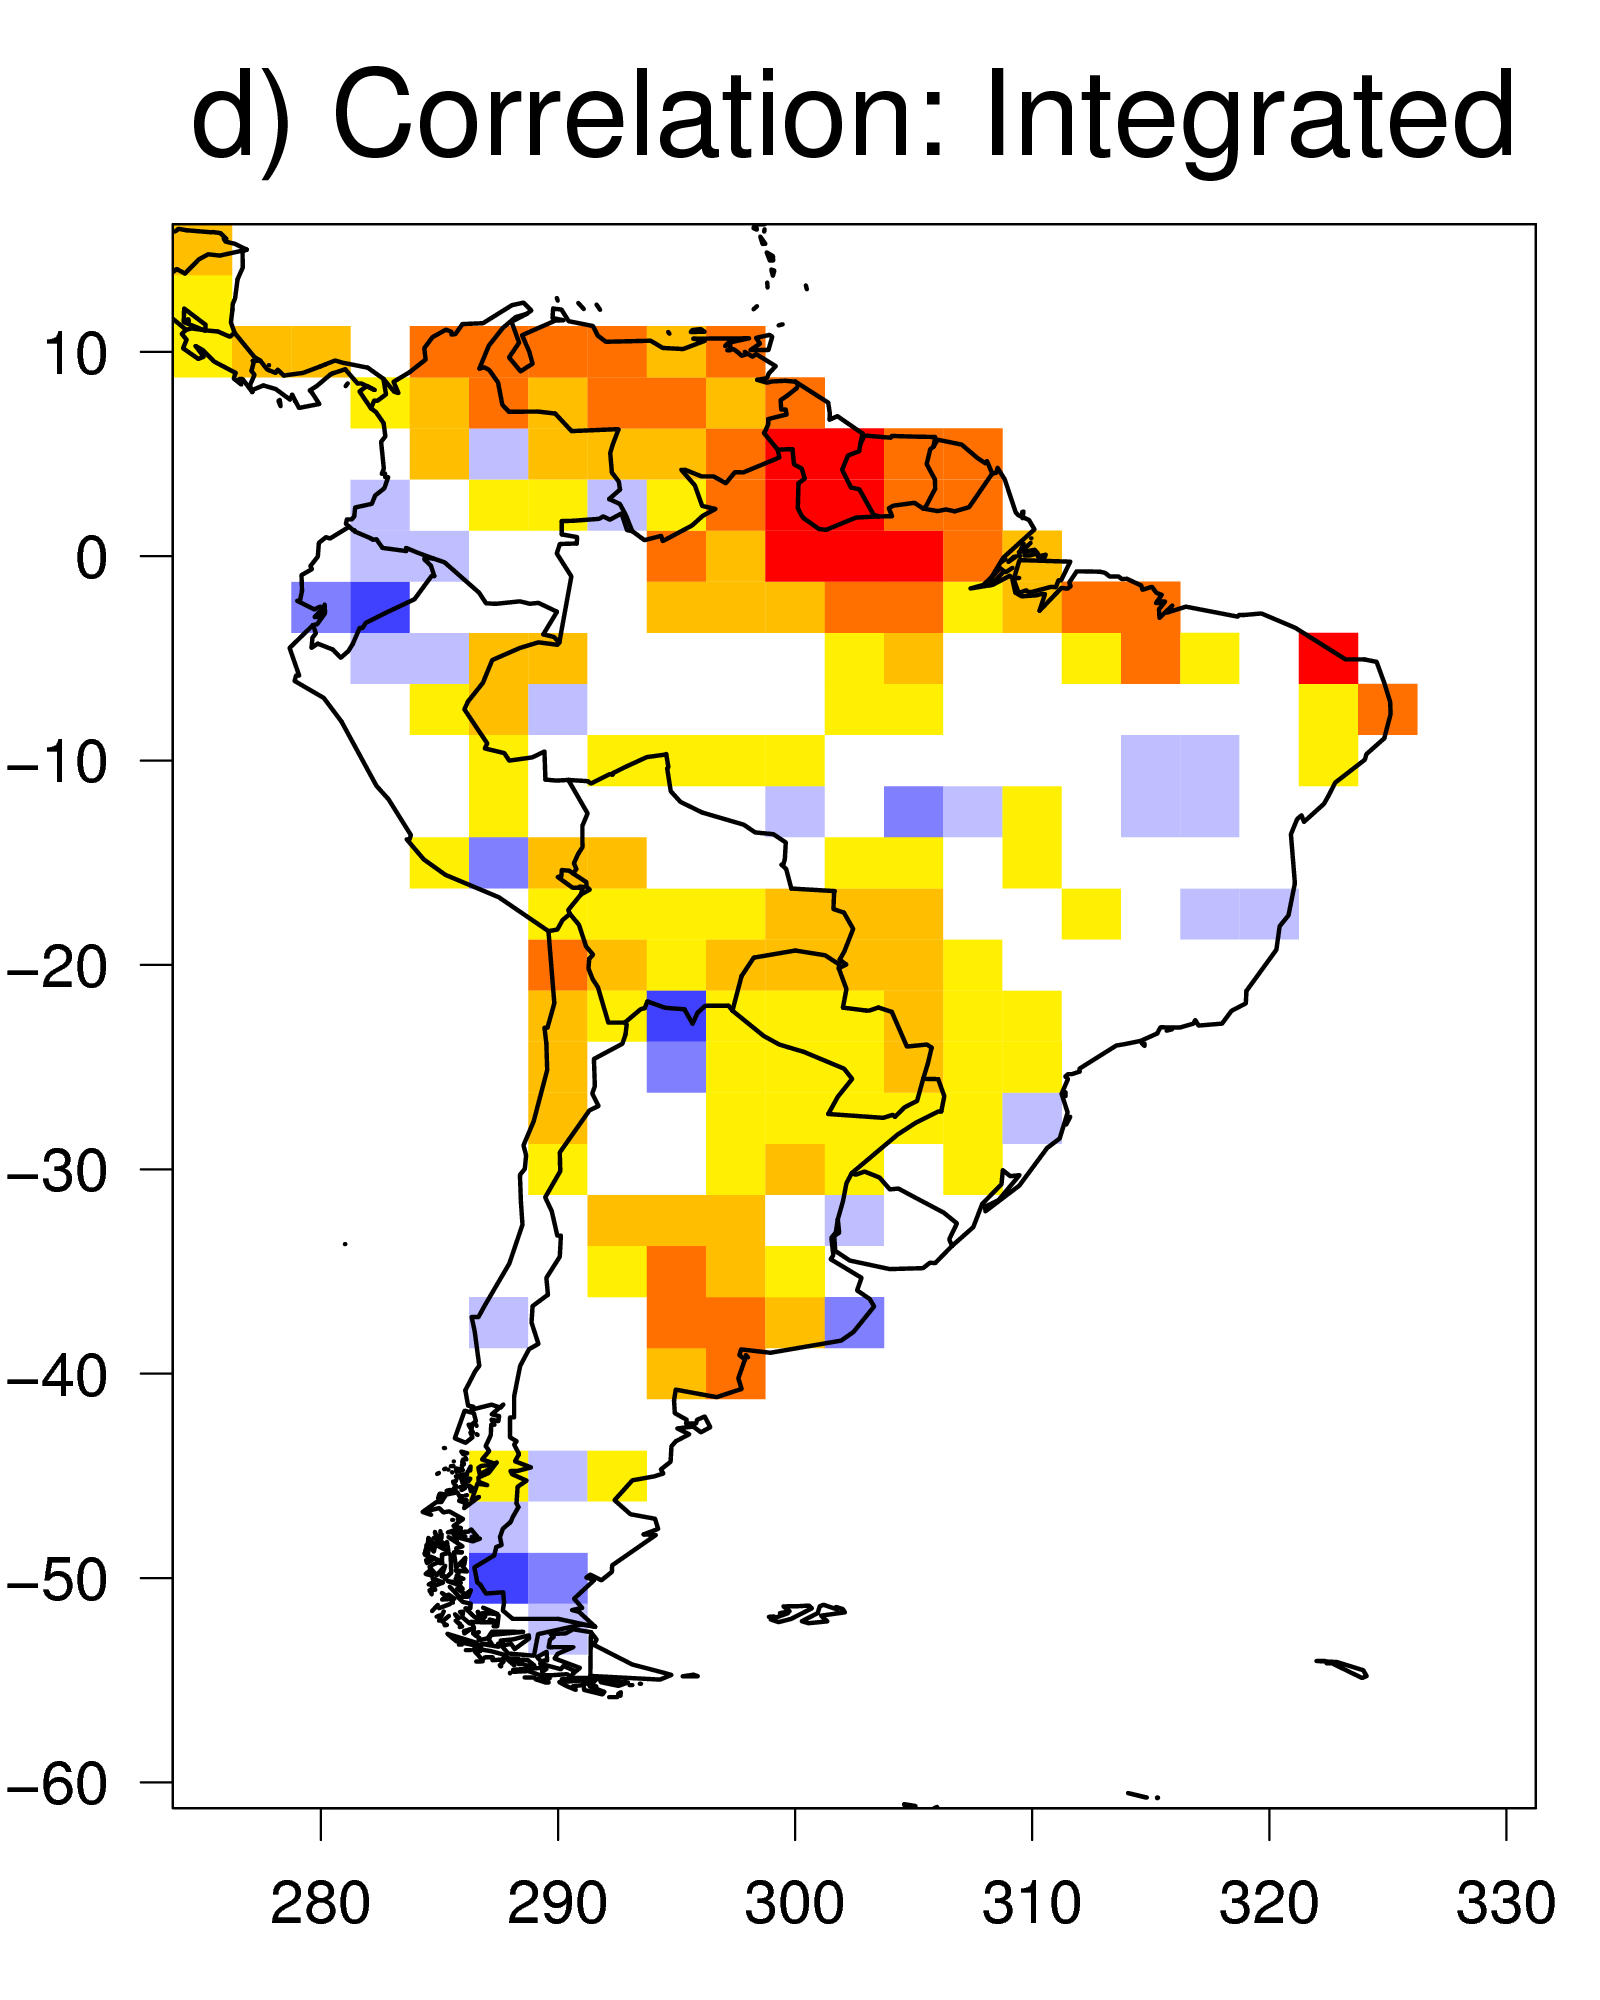
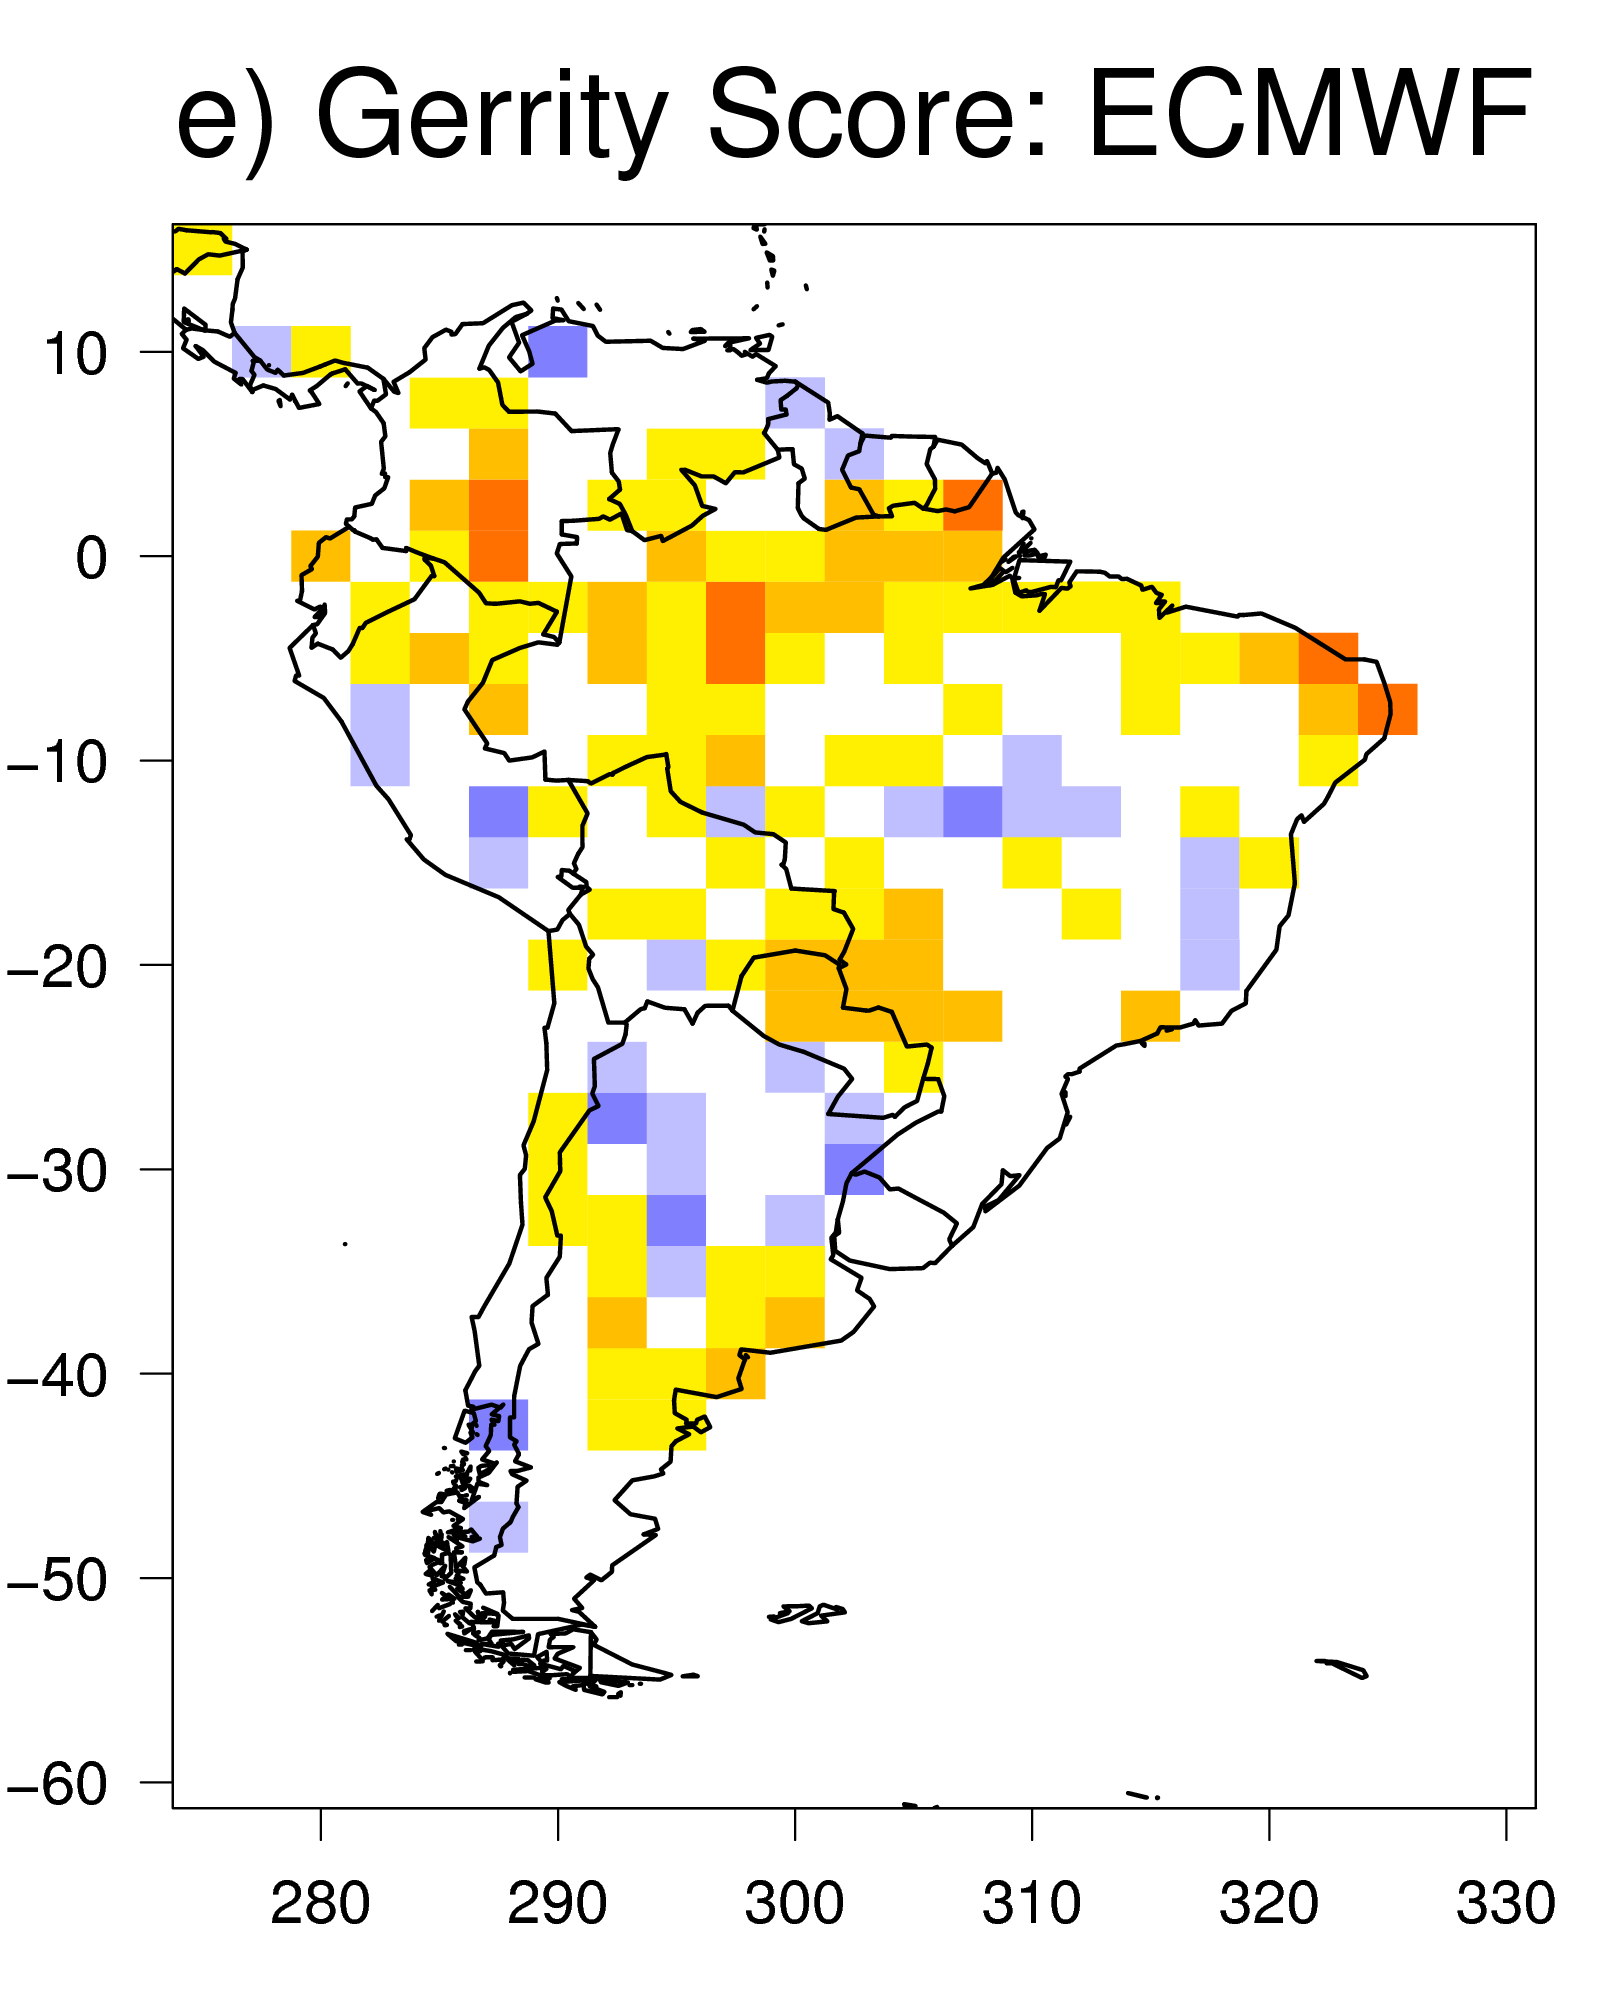
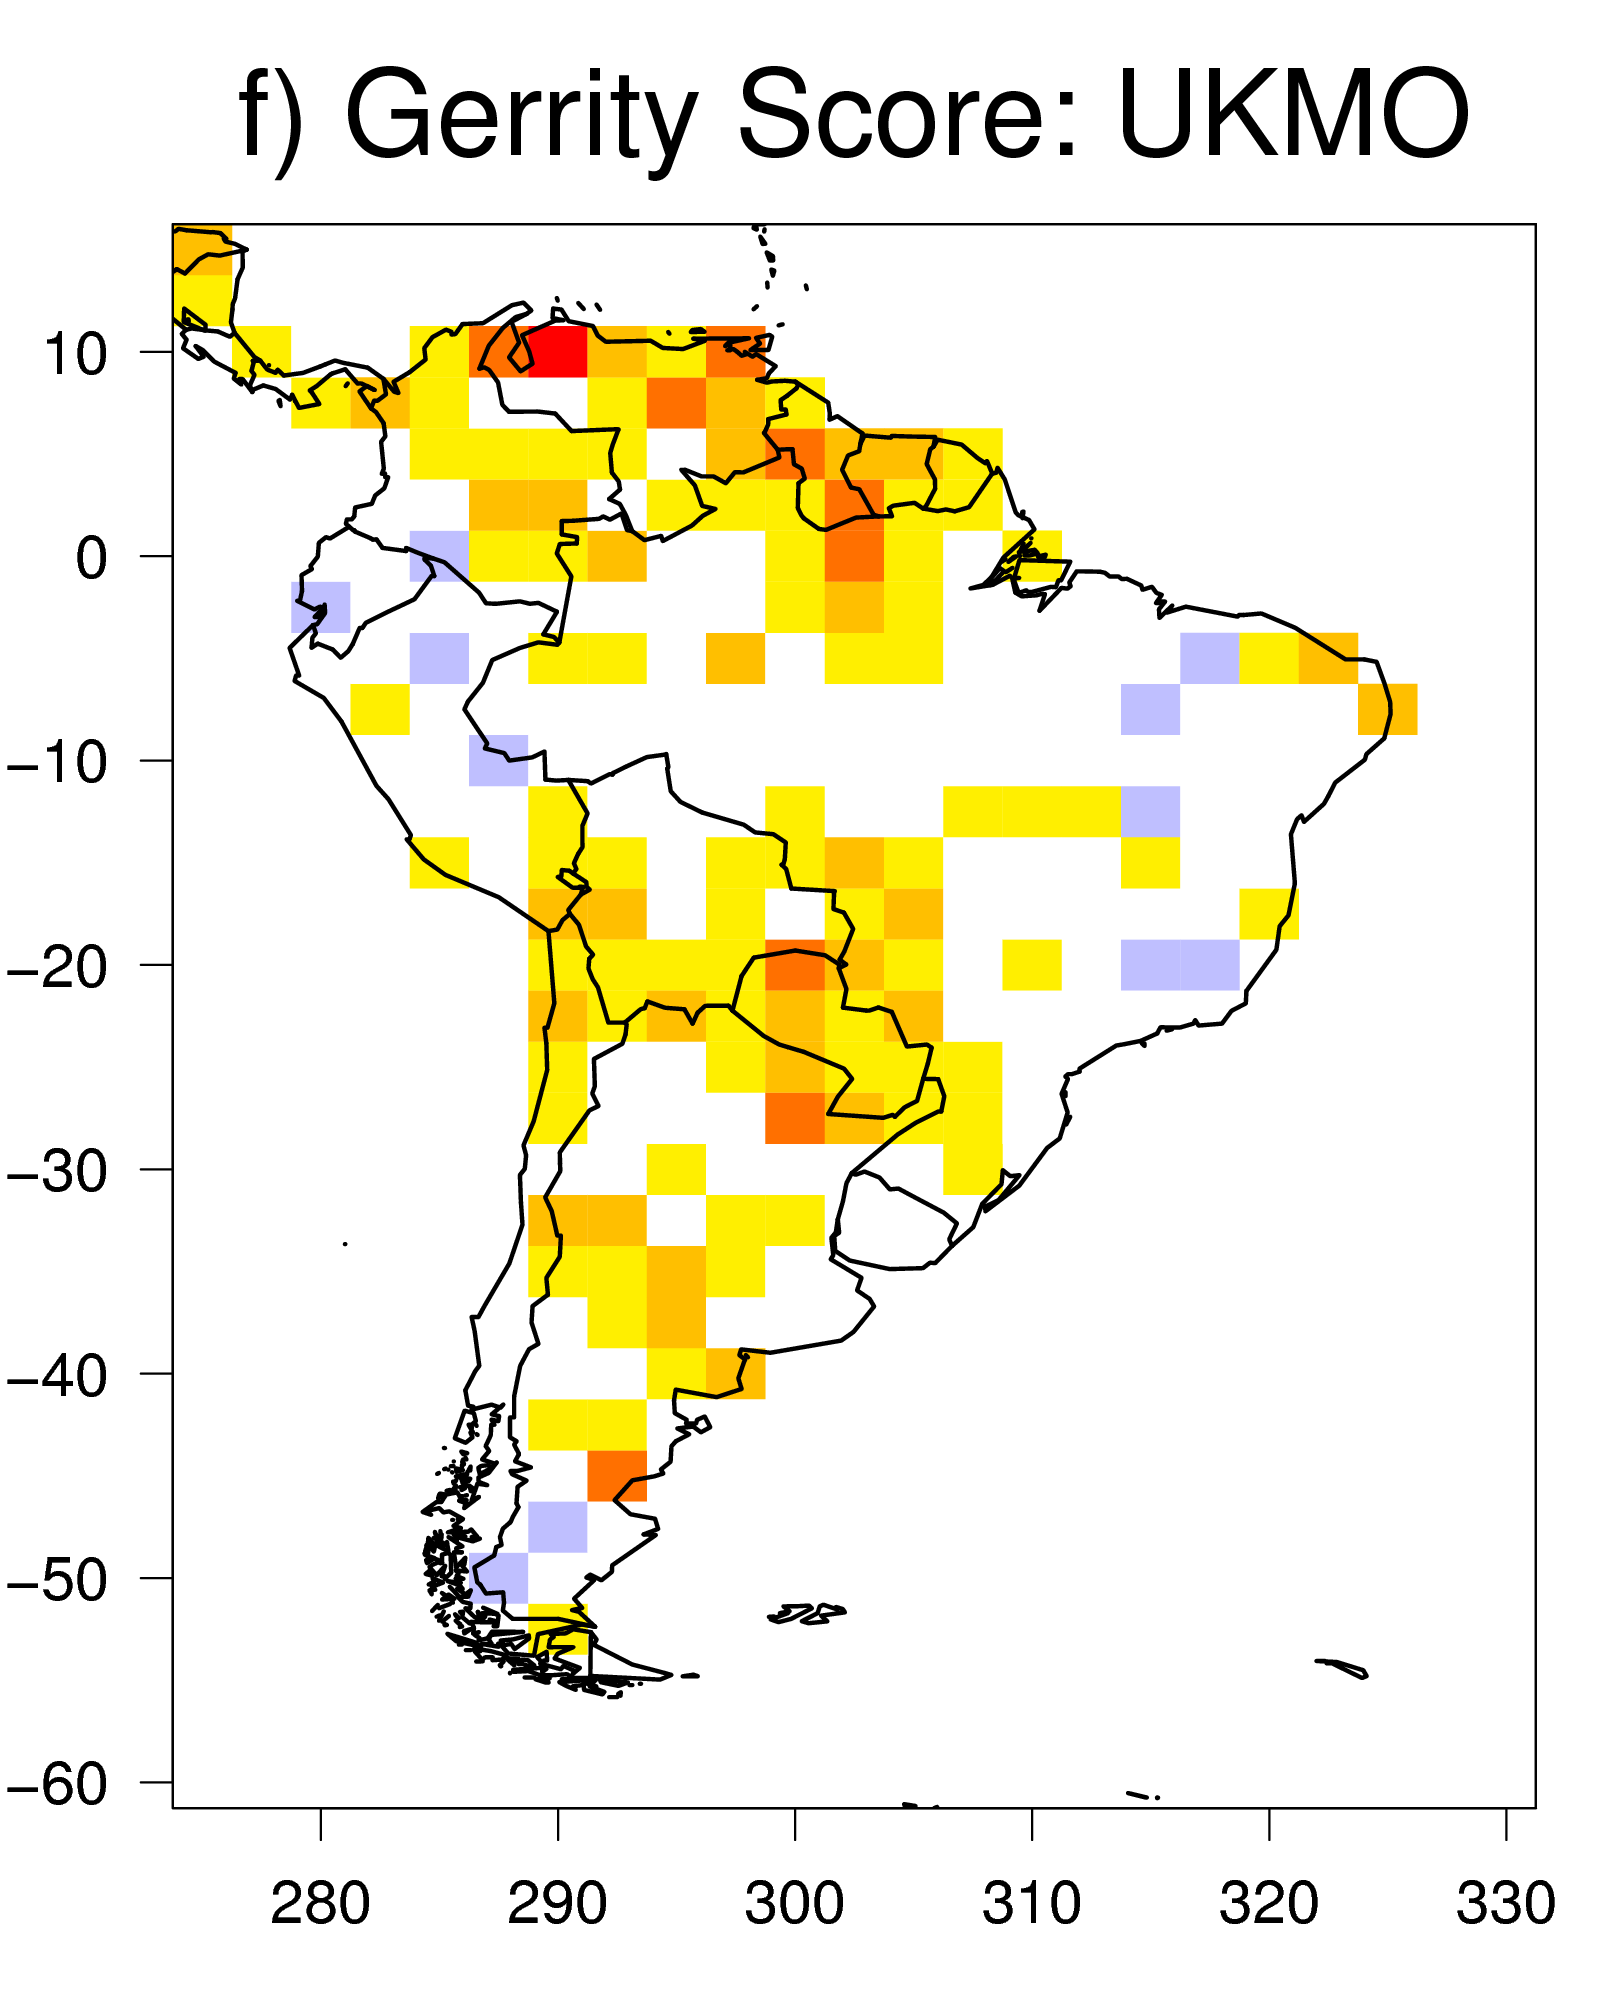
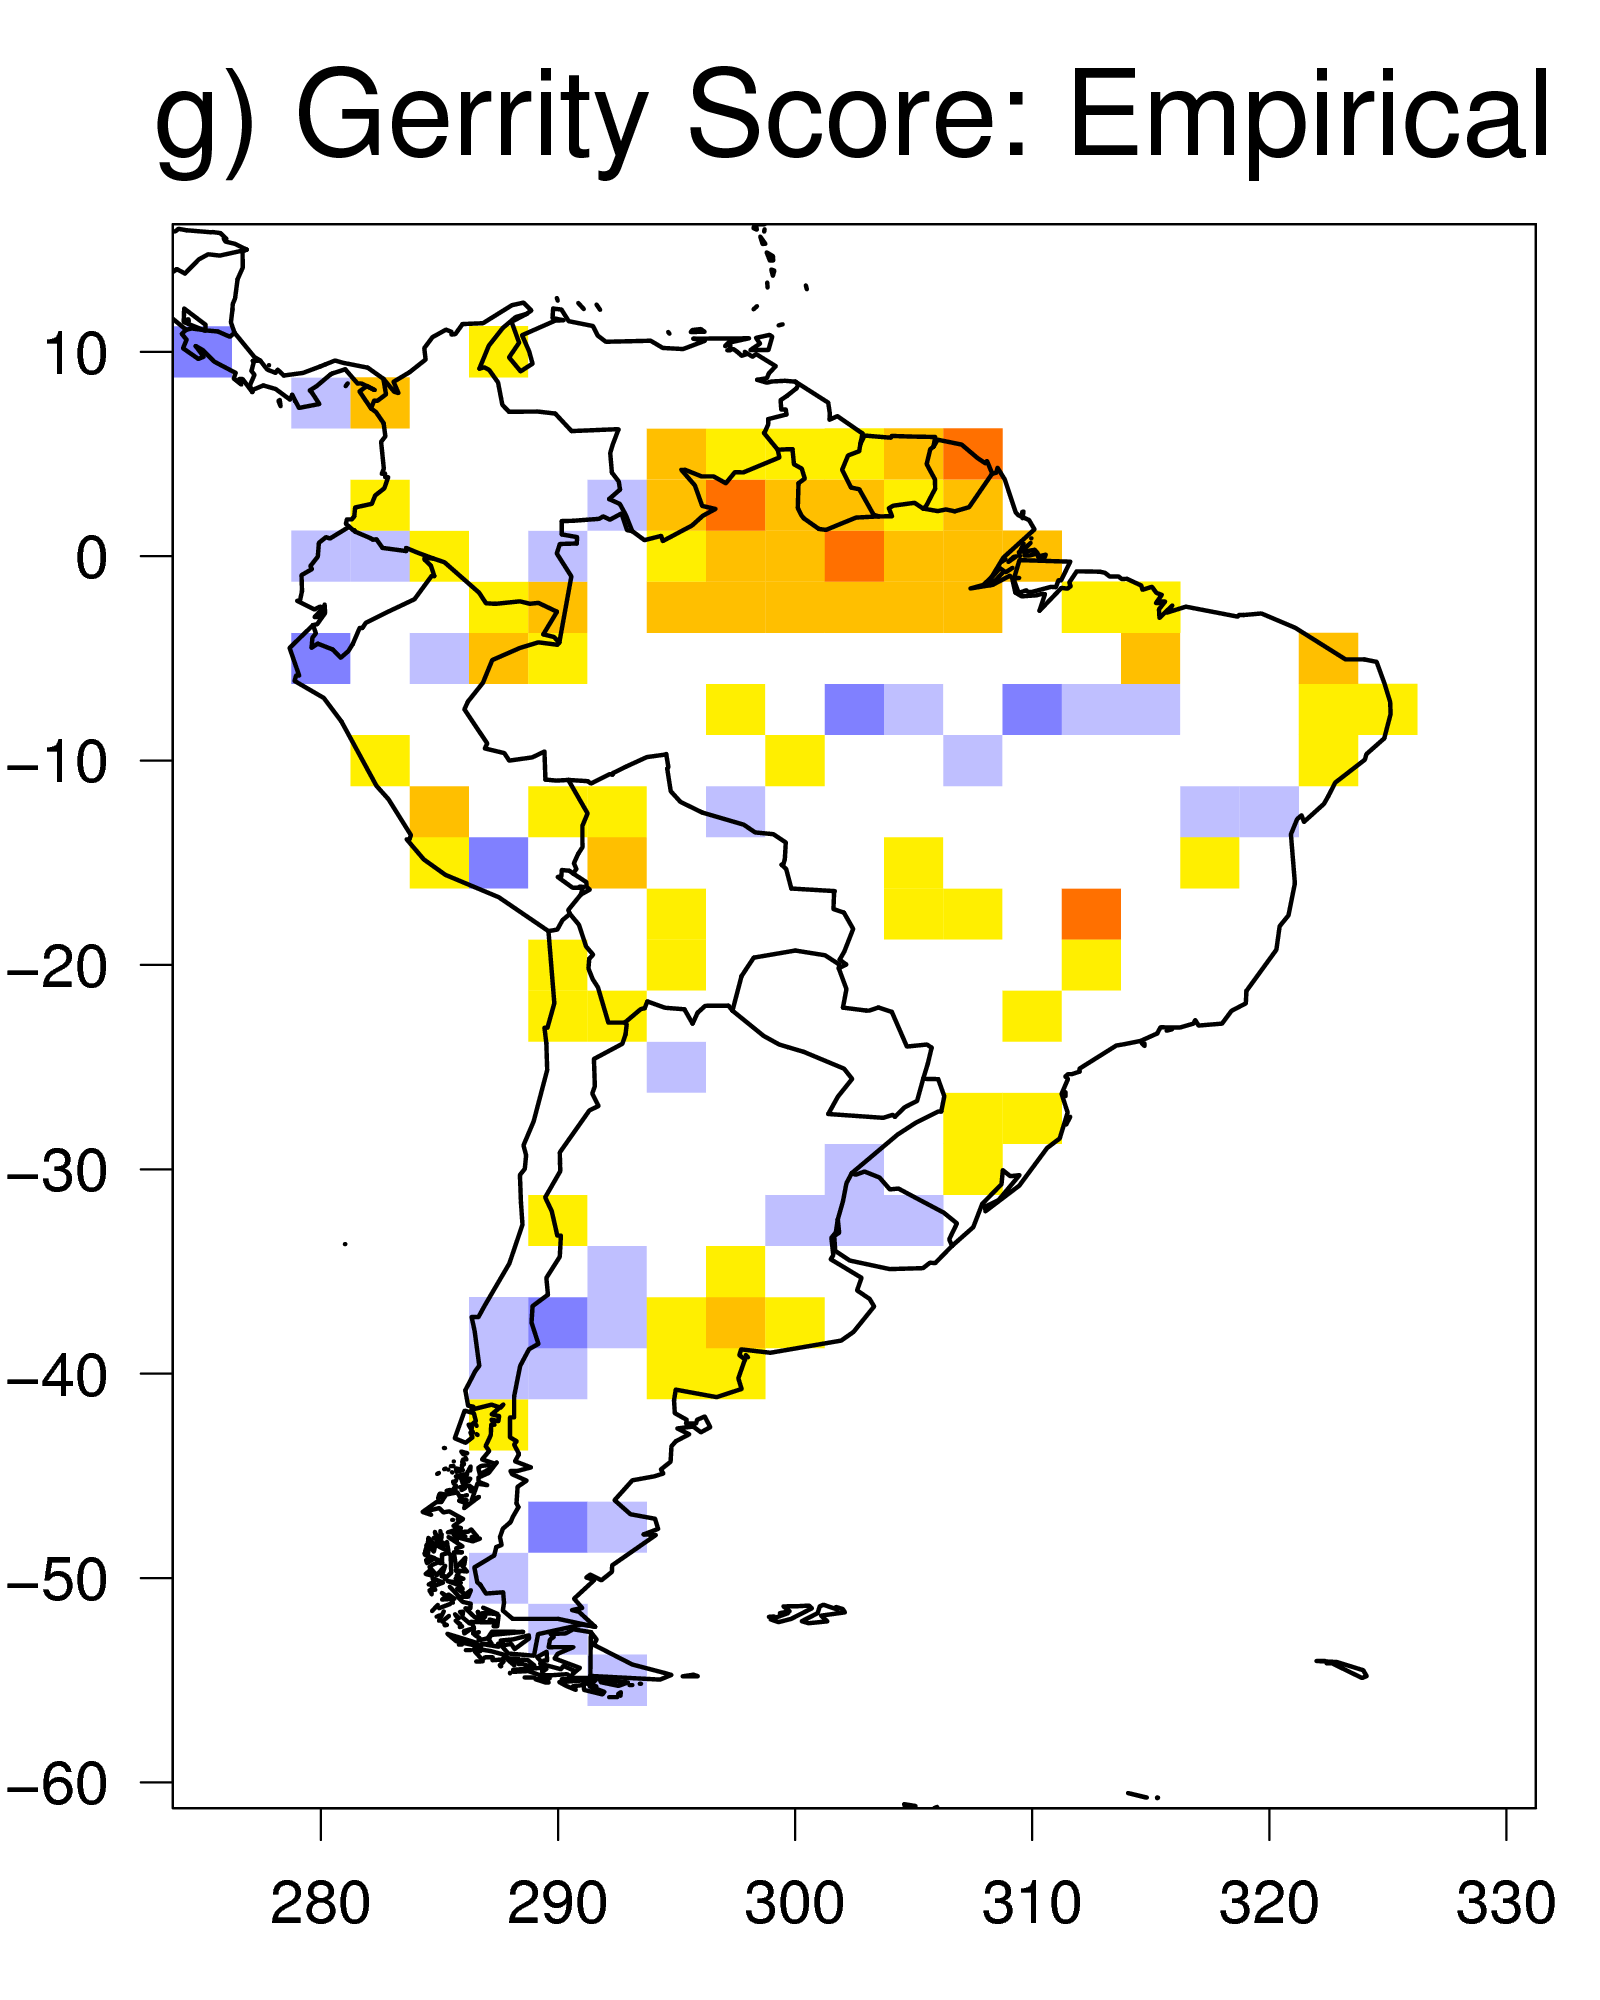
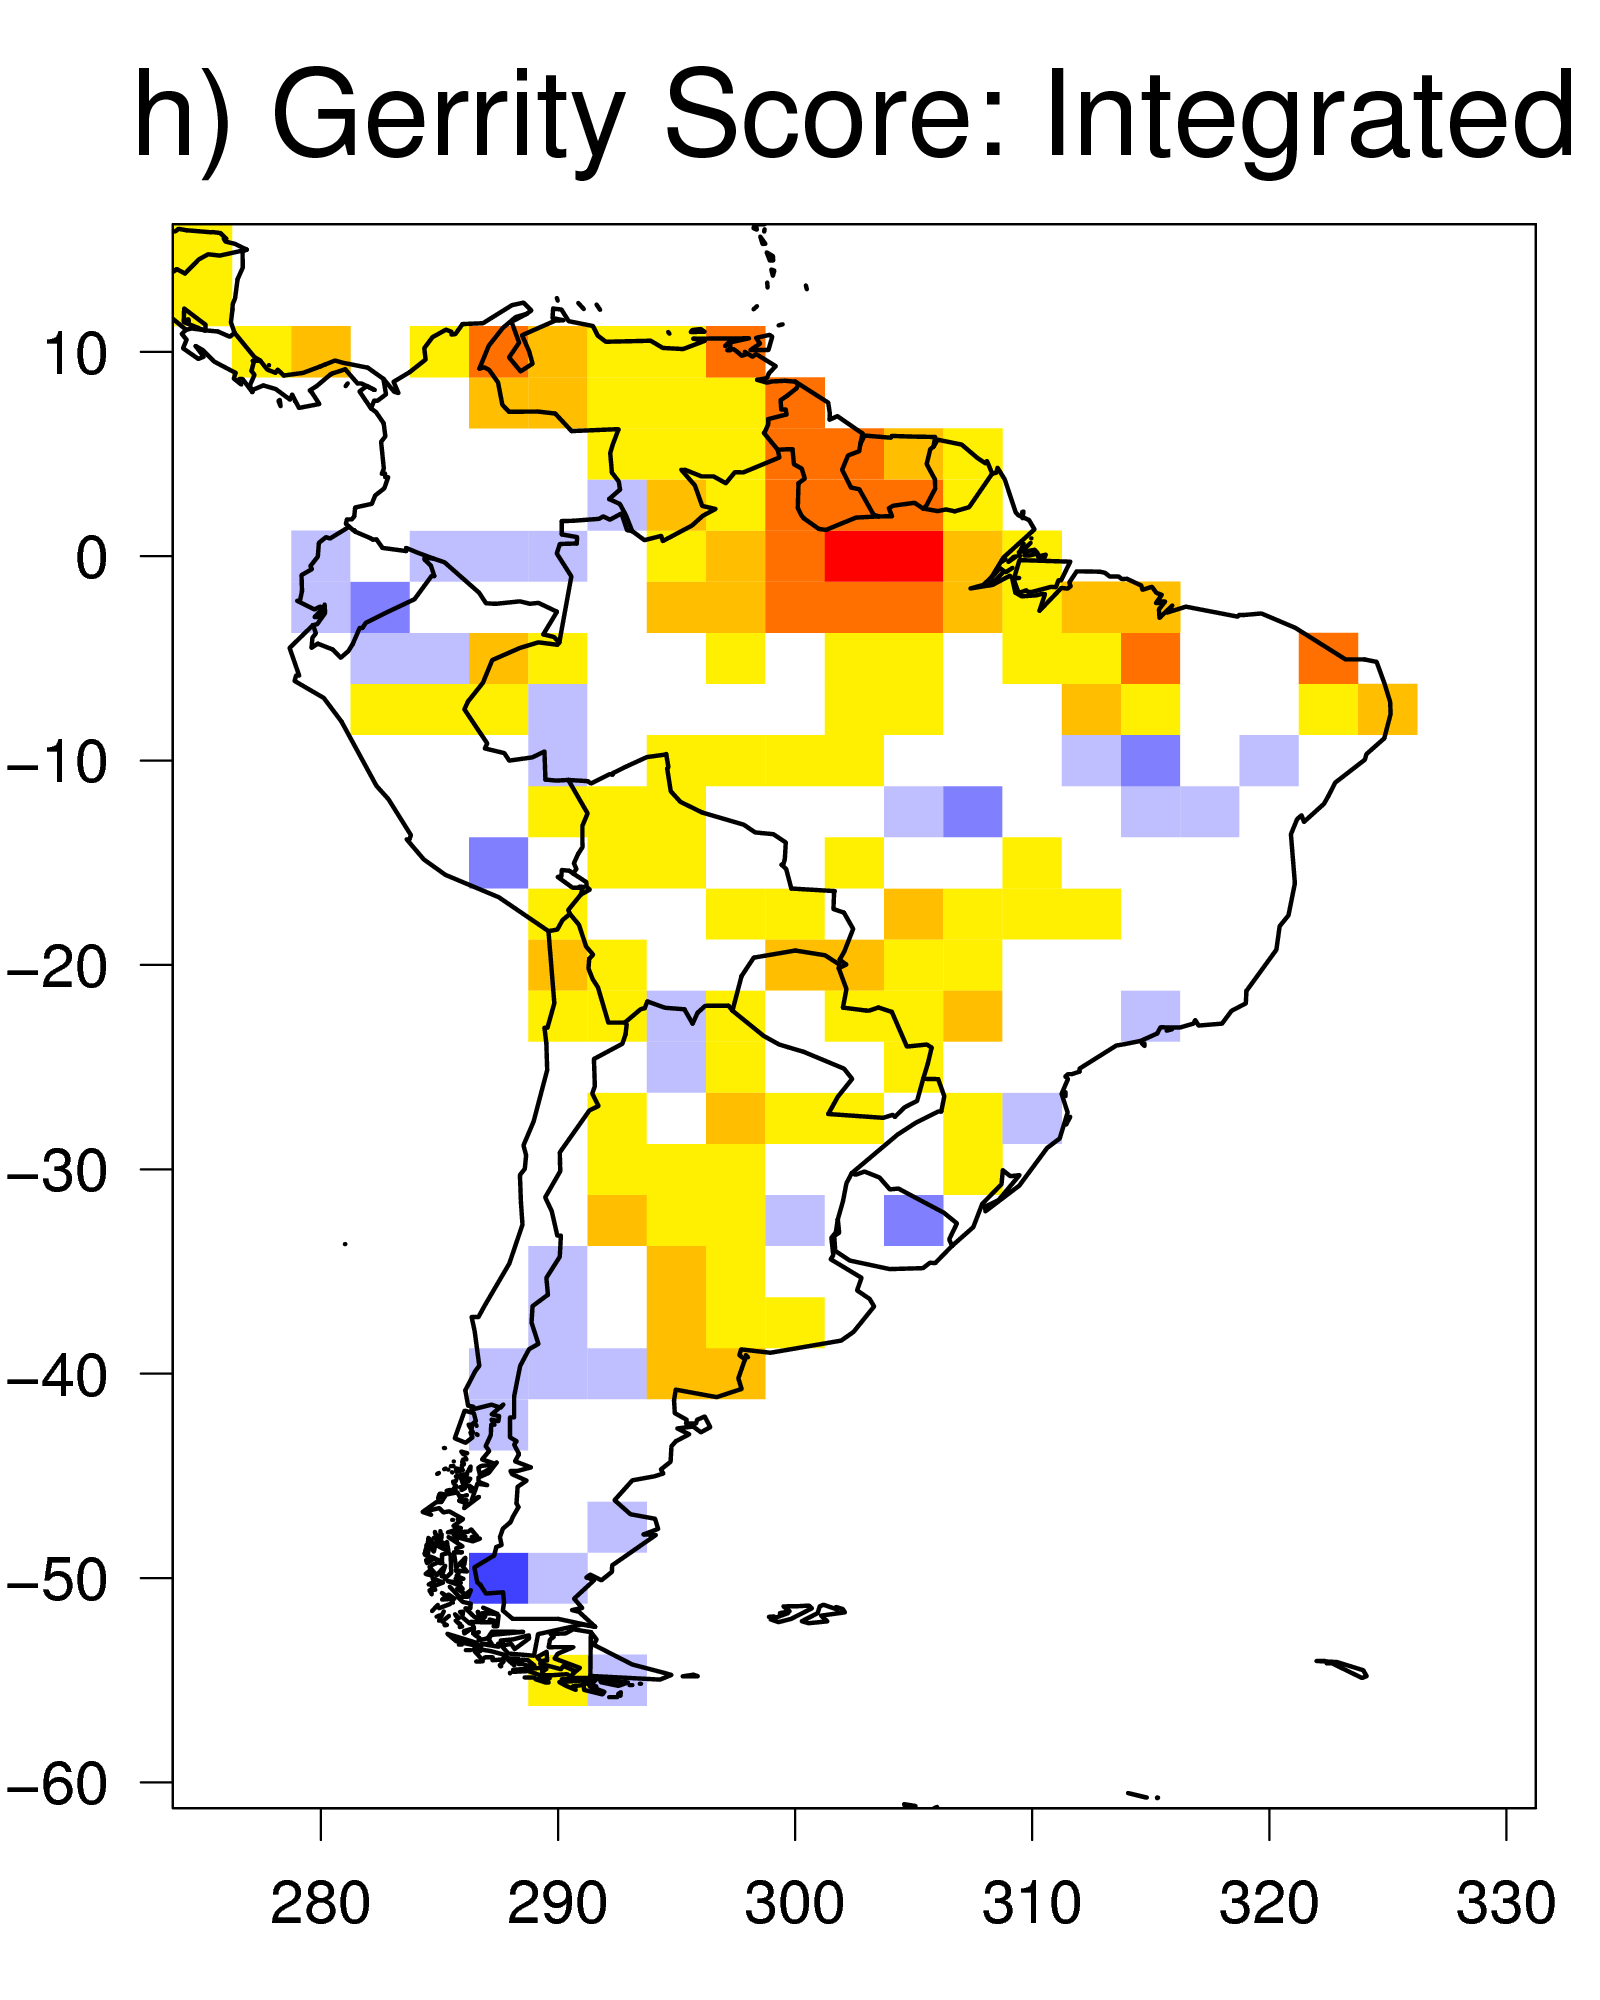
Figure 1: Correlation maps (panels a-d) and Gerrity score maps (panels e-h) of ECMWF, UKMO, empirical and integrated one month lead June-July-August precipitation forecasts for the period 1987–2001.
|
|
|
|
|
|
|
|
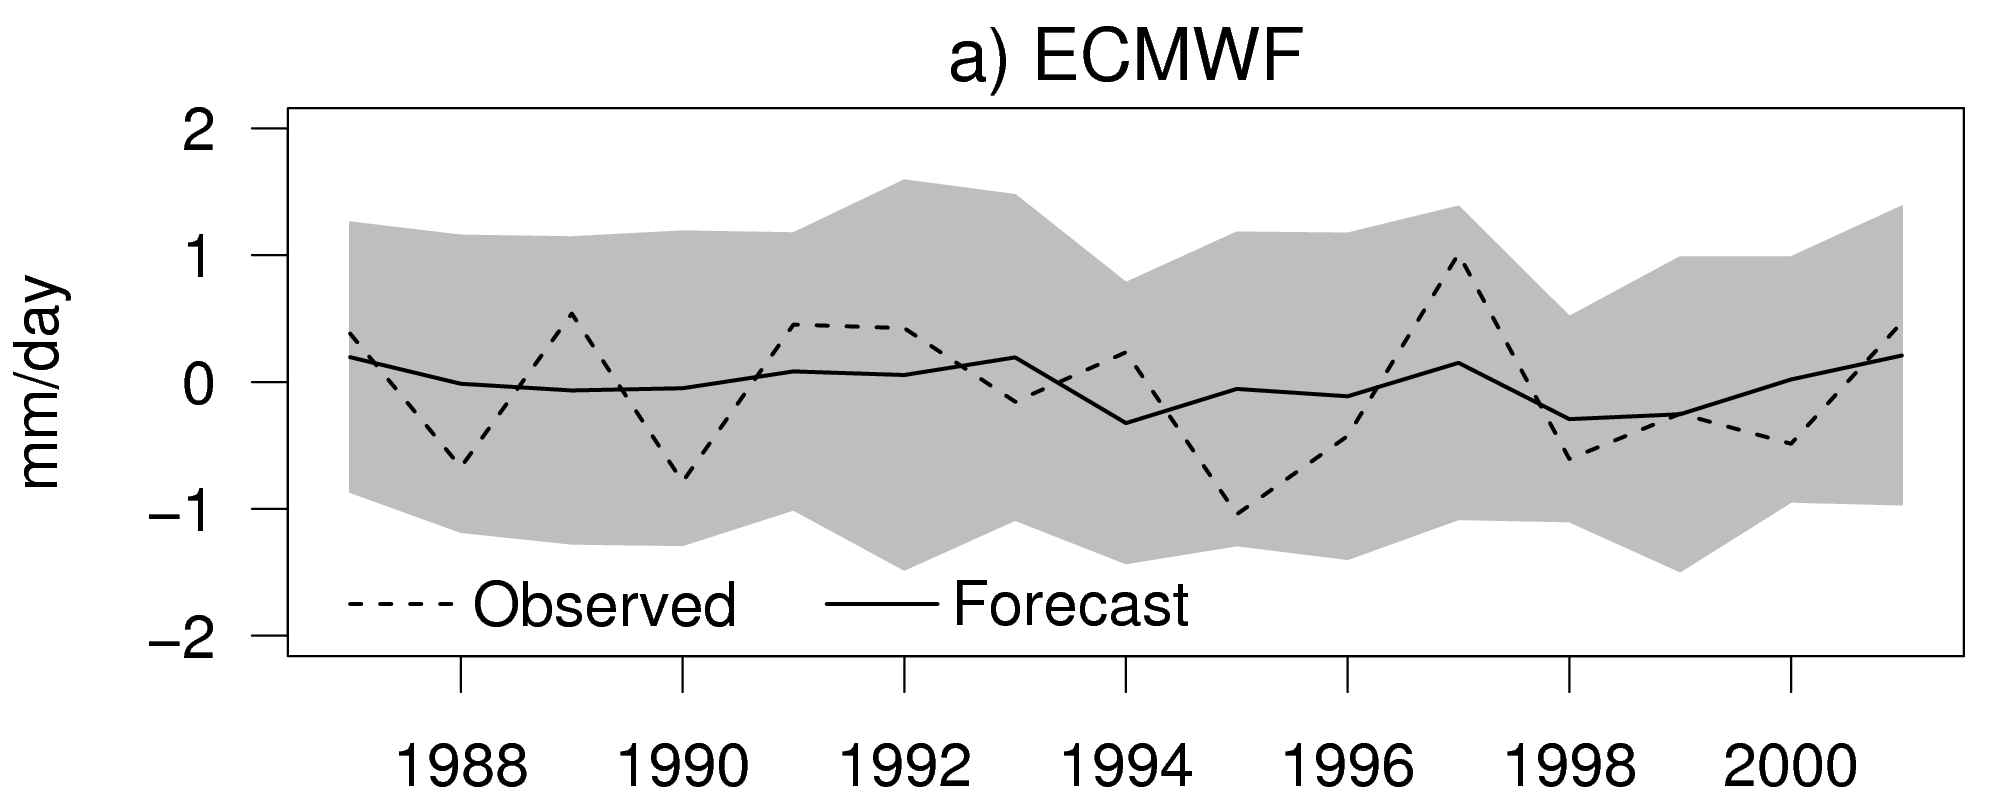
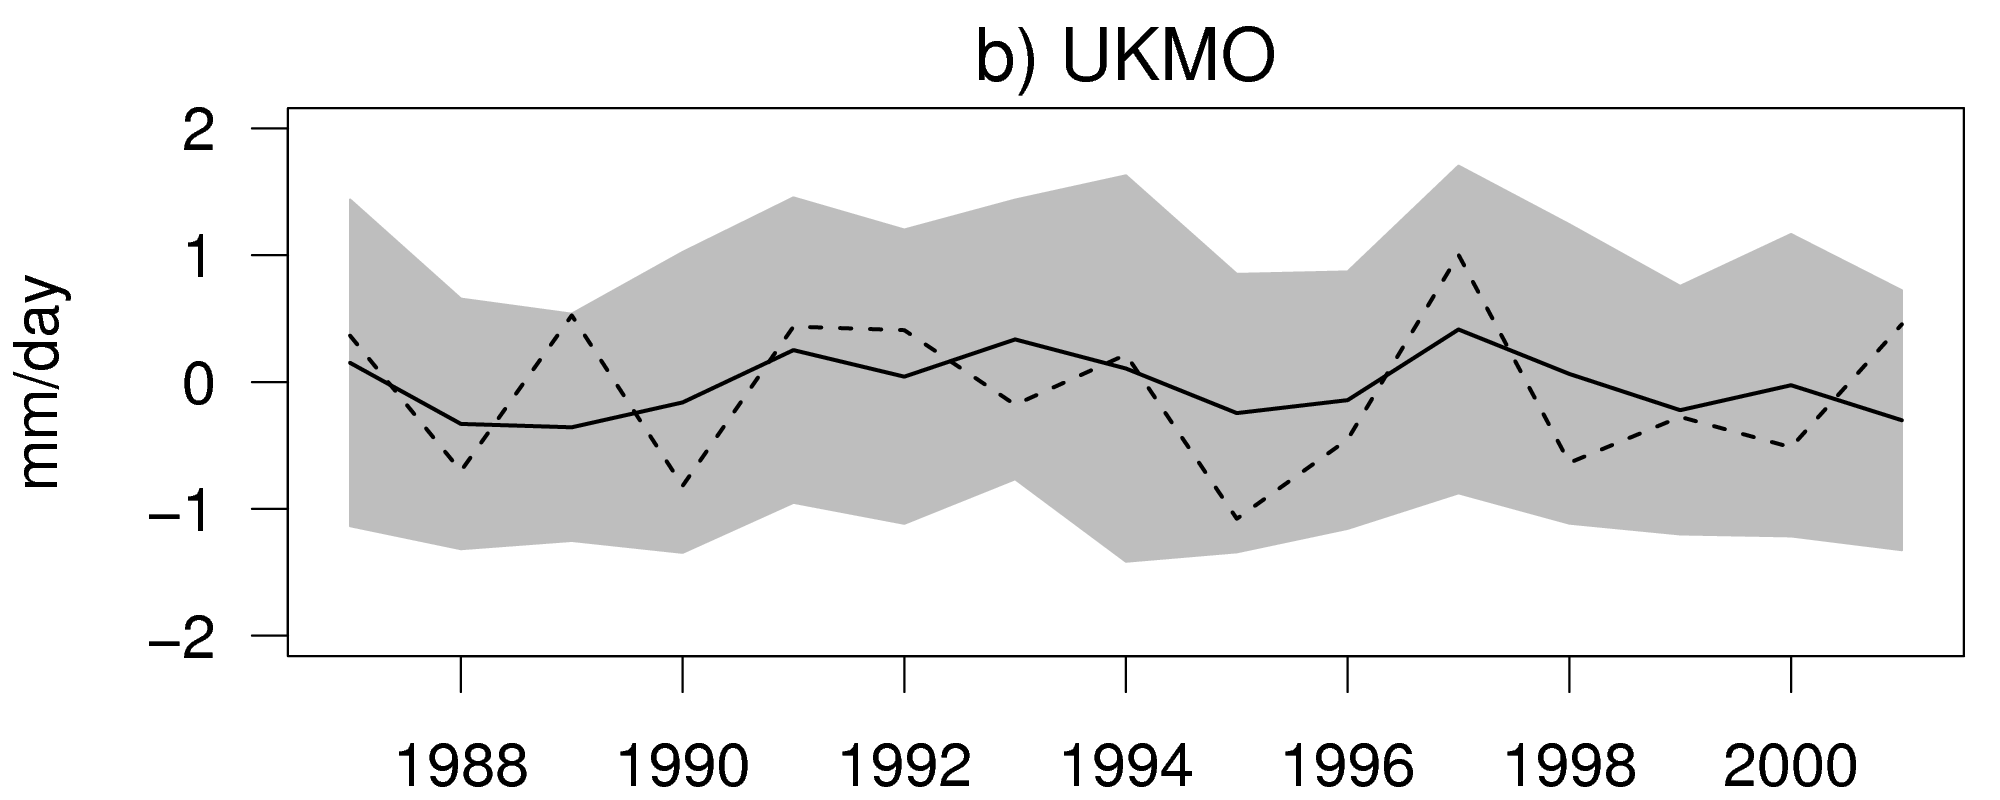
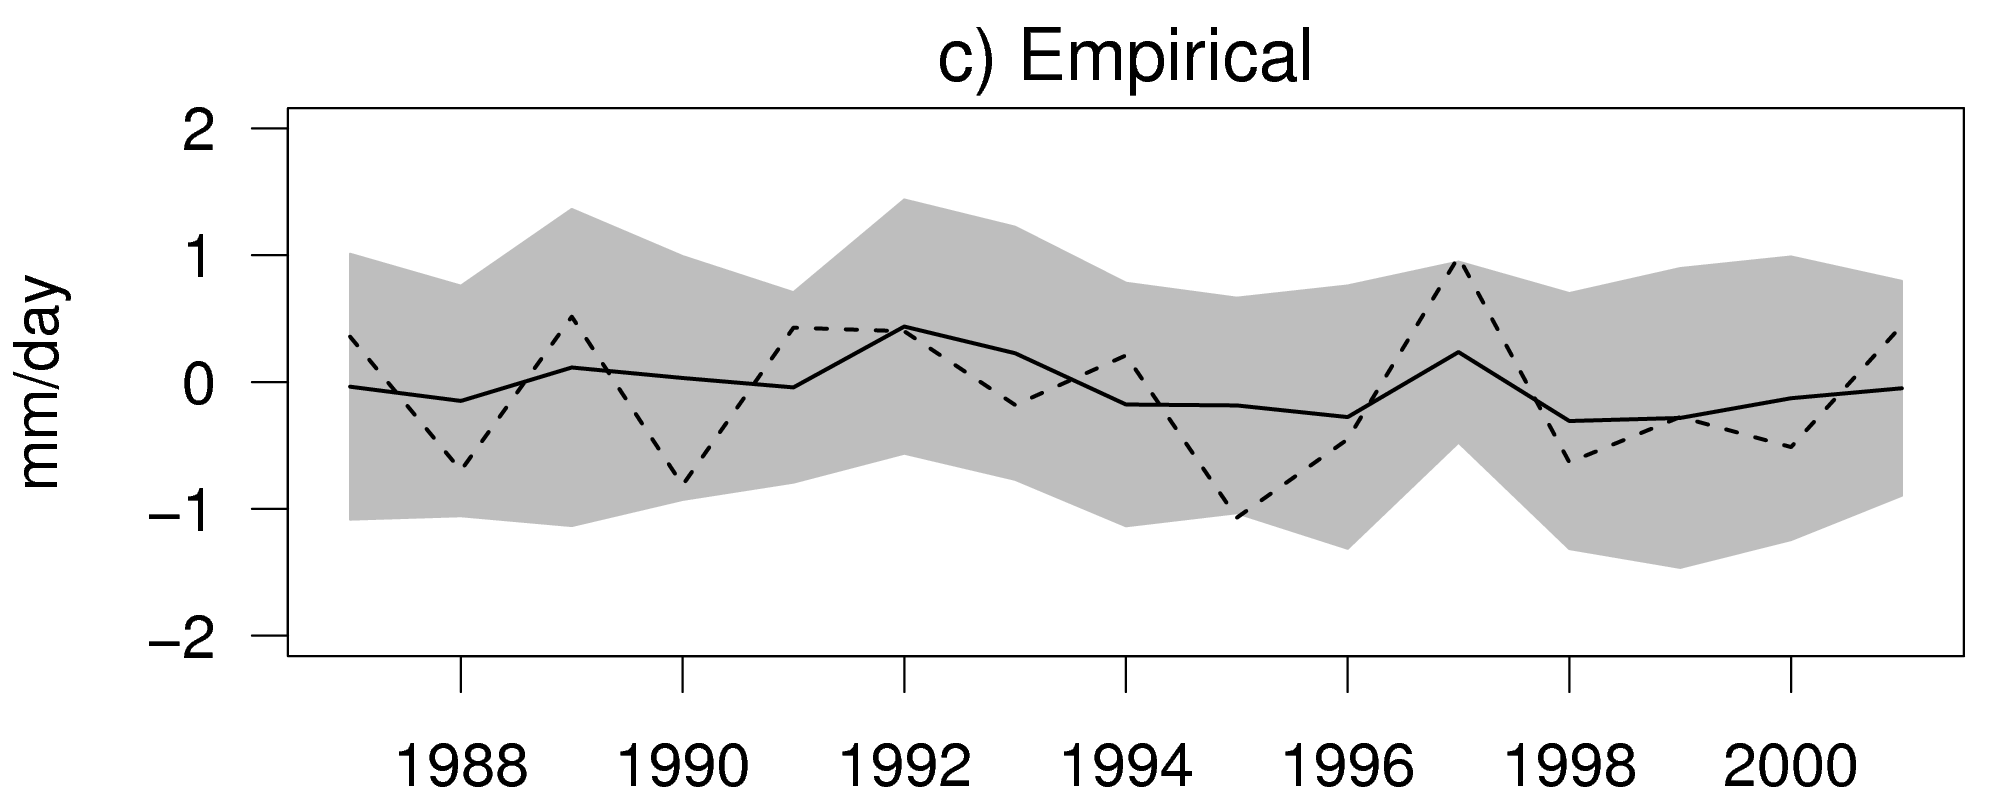
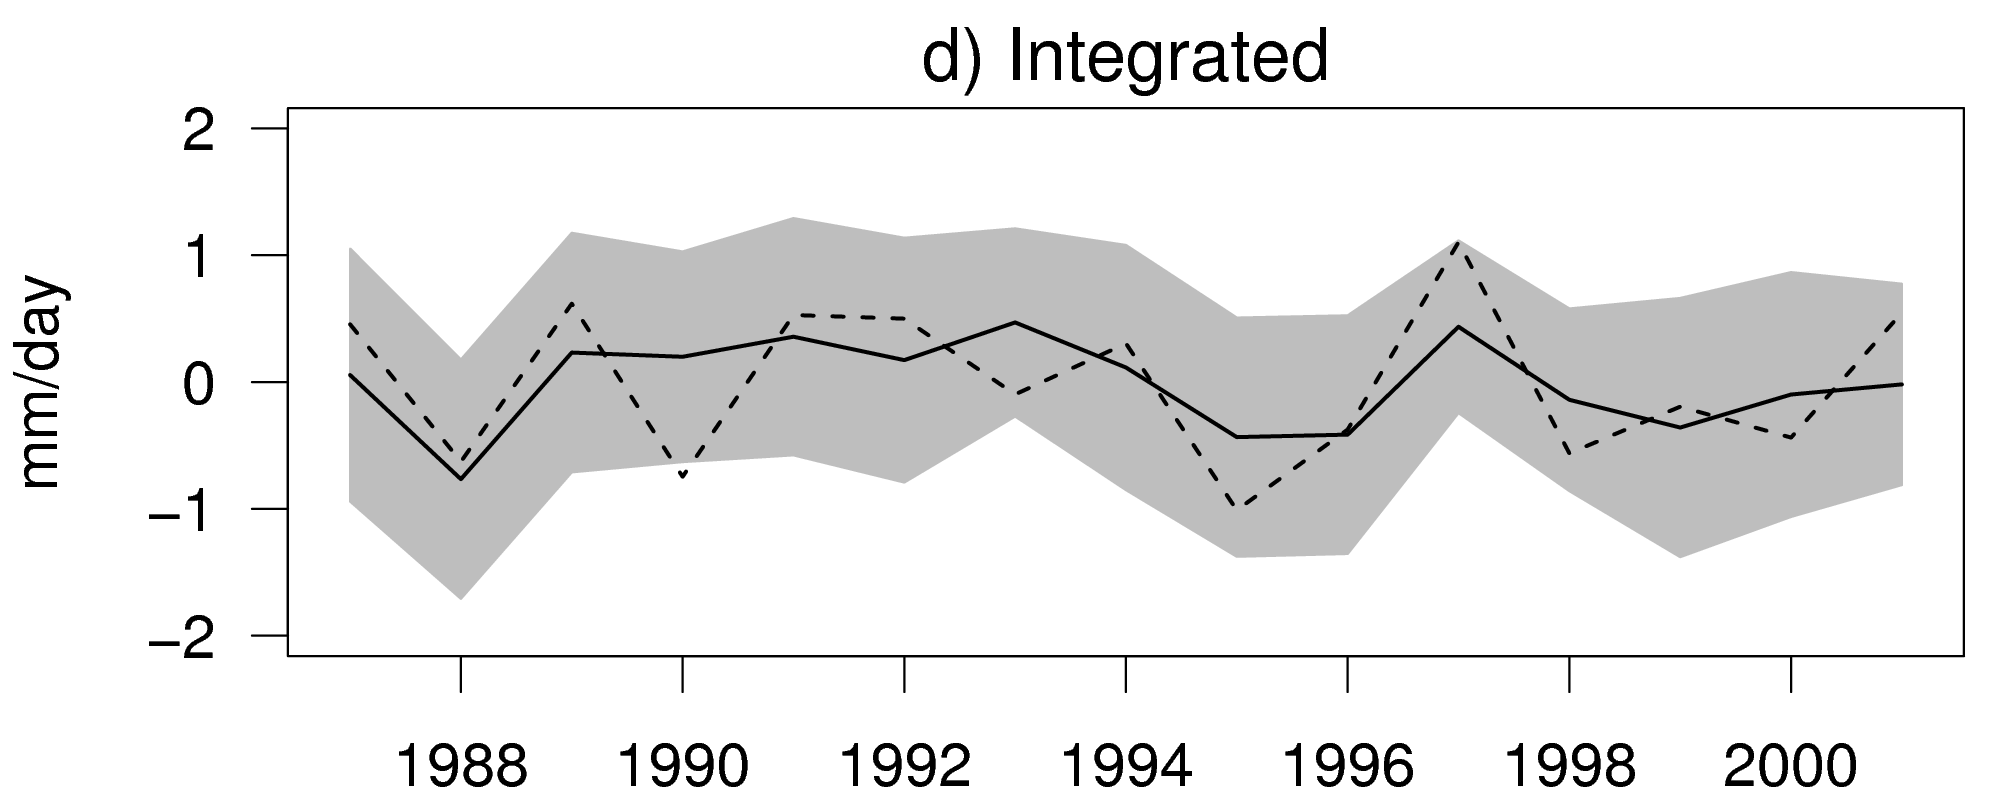
Figure 2: One-month lead June-July-August 1987–2001 precipitation anomaly forecasts (mm/day) for a grid point in southeast South America (longitude 297.5o; latitude -37.5o) produced by a) ECMWF coupled model, b) UKMO coupled model, c) empirical model and d) integrated (combined and calibrated) with forecast assimilation. Observed values (dashed line), forecast (solid line), and the 95% prediction interval (grey shading).
34985 PROCUREMENT PLAN FOR THE INTEGRATED MANAGEMENT OF CRITICAL
40 INTEGRATED SMALLENTERPRISEDEVELOPMENT STRATEGY INTEGRATED SMALLENTERPRISEDEVELOPMENT STRATEGY UNLOCKING THE
402d-Resource-Integrated-Pest-Management-Plan-sample-10-9-08
Tags: america caio, south america, climate, forecasts, integrated, america, south, seasonal
- NZQA UNIT STANDARD 23006 VERSION 3 PAGE 2 OF
- SEGURO DE BAJA LABORAL CSIF IMPRESO DE COMUNICACIÓN DE
- 9 CONTRACT DE LUCRĂRI NRDATA ÎN TEMEIUL OUG NR342006
- CSOP2 KÉRJÜK NYOMTATOTT BETŰVEL KITÖLTENI! FELHATALMAZÁS CSOPORTOS BESZEDÉSI MEGBÍZÁS
- 2 CHAPTER 5 MORE SQL COMPLEX QUERIES TRIGGERS VIEWS
- SENARAI PENILAI 1 DAN PENILAI 2 BAGI PENGETUA GURU
- 1 FSCBC10 CONTRACT DE PRESTĂRI SERVICII NR DATA
- MODELO NRO 08 PARA FORMAR UNA SOCIEDADEMPRESA 74 Y
- PLAN DOCENTE AÑO ACADÉMICO 200405 Nº DE LA ASIGNATURA
- COMO EN CUALQUIER FESTIVAL DE CINE AQUÍ LOS ACTORES
- THE REVOLUTION OF 1820 AND THE ADVENT OF LIBERALISM
- DISTRICT 35A UIL ACADEMIC MEET M ARCH 27TH 2021
- C COMPLETED FORMS DUE ANNUALLY BY DECEMBER 1ST MAIL
- TỔNG LIÊN ĐOÀN LAO ĐỘNG VIỆT NAM LIÊN ĐOÀN
- POWIATOWY PROGRAM PRZECIWDZIAŁANIA PRZEMOCY W RODZINIE NA TERENIE POWIATU
- 1 OBJETO FACILITAR LA INTEGRACIÓN DEL NUEVO ALUMNADO EN
- STREDNÁ ODBORNÁ ŠKOLA ELEKTROTECHNICKÁ SAJEDLIKA A OBCHODNÁ AKADÉMIA B
- CENTRO 1511 LICENCIATURA EN ECONOM? ASIGNATURA 10753
- SEMEJANZA Y TRIGONOMETRÍA 7 ANTES DE EMPEZAR 1SEMEJANZA ……………………………………
- SC PIEŢE PREST SA ANEXA NR 1 ANALIZA BILANŢULUI
- ITH124GA5 – PÁG 3 CONVENCIÓN PARA LA SALVAGUARDIA DEL
- TITLE I SCHOOLWIDE COMPREHENSIVE PLAN COMPONENTS TEMPLATE A
- COMISIA DE VERIFICARE A DREPTULUI DE PROPRIETATE SAU A
- RD INSTRUCTION 2024F TABLE OF CONTENTS PAGE 1 PART
- (VARDAS IR PAVARDĖ DIDŽIOSIOMIS RAIDĖMIS) (ADRESAS TELEFONAS) VILNIAUS
- CHAPTER 1 ~OUR STORY TAKES PLACE FROM 16681670 ~HENRY
- 4 IMPACT EVALUATION WHY WHAT HOW AND WHO?
- SONGS CHANTS AND RHYMES IN KS1 CLASSROOMS TEXTBOOK LONGMAN
- C UMBRIA COUNTY COUNCIL 2021 MAIN ADMISSIONS ROUND
- ALLEGATO A2 MODELLO DI COMUNICAZIONE DA TRASMETTERE QUANDO È
8 WHAT IS OLIVER O’DONOVAN’S “WORD OF ADVICE TO
 TRAMITES DE CAMBIO DE DOMICILIO Y RECTIFICACIONES DEL DOCUMENTO
DISTRIBUIÇÃO POR ÓRGÃO TESOURO OUTRAS FONTES TOTAL 1 PODER
MAIL FROM HUBERT FECHER ARSENAL 1010 2002 DEAR
FILATELISTIČNA ZVEZA SLOVENIJE OKVIRNE TOČKE PROGRAMA DELA IO FZS
ODBORNÉ PODMÍNKY PRO JMENOVÁNÍ ZNALCEM V OBORU EKONOMIKA ODVĚTVÍ
 ANNEX FUNDS 13 COMMITMENT FORM (NOT APPLICABLE TO
 APRUEBANSE LAS NORMAS DE ESTERILIZACION ELABORADA POR LA COMISION
 LUCHA CONTRA LA CORRUPCIÓN Y ESPACIOS DE IMPUNIDAD
  BUSINESS WORKSHOP «BUY CROATIA» 18 MAY 2011 TOUR PROGRAM
MAL BILDIRIMINDE BULUNULMASI HAKKINDA YÖNETMELIK ( 10081990 TARIH VE
 STRATEGIA ROZWOJU GMINY MOSKORZEW ROZDZIAŁ I STRATEGIA ROZWOJU GMINY
 DOSSIER DE DEMANDE DE CHANGEMENT DE PRENOM POUR
SISTEMA DE AYUDA A LA MATRÍCULA (SAM) LA UNIVERSIDAD
ID 6 MONTH ICQ WE ARE INTERESTED IN
KONTROLA BILETÓW 1 KONTROLA BILETÓW PRZEPROWADZANA JEST PRZEZ OSOBY
NL 01 2004 BETREFT PREPARATEURVERGUNNINGEN CODE VAN TOEGESTANE ACTIVITEIT
 PEDRO LEMEBEL TENGO MIEDO TORERO TÍTULO ORIGINAL TENGO
 SEX OFFENDING BY MAINE YOUTH THEIR OFFENSES AND CHARACTERISTICS
THIS PROGRAM DOES THE EVL BASELINE & RANDOM MODELS
