SIAM 19291930 INCOME CLASS NUMBER OF HOUSEHOLDS PERCENTAGE OF
SIAM 19291930 INCOME CLASS NUMBER OF HOUSEHOLDS PERCENTAGE OF
Siam 1929-1930
Siam 1929-1930
|
Income Class
|
Number of households |
Percentage of households |
Average income per capita (baht per annum) |
Income in terms of per capita mean |
|
1 |
777455 |
6.70 |
5.48 |
0.18 |
|
2 |
504047 |
4.34 |
7.97 |
0.26 |
|
3 |
297273 |
2.56 |
8.36 |
0.27 |
|
4 |
777455 |
6.70 |
8.44 |
0.28 |
|
5 |
777455 |
6.70 |
11.16 |
0.37 |
|
6 |
504047 |
4.34 |
13.14 |
0.43 |
|
7 |
297273 |
2.56 |
13.26 |
0.43 |
|
8 |
722467 |
6.22 |
13.43 |
0.44 |
|
9 |
777455 |
6.70 |
14.87 |
0.49 |
|
10 |
297273 |
2.56 |
17.58 |
0.58 |
|
11 |
504047 |
4.34 |
18.43 |
0.60 |
|
12 |
722467 |
6.22 |
23.23 |
0.76 |
|
13 |
297273 |
2.56 |
24.02 |
0.79 |
|
14 |
504047 |
4.34 |
26.33 |
0.86 |
|
15 |
777455 |
6.70 |
27.77 |
0.91 |
|
16 |
722467 |
6.22 |
32.60 |
1.07 |
|
17 |
722466 |
6.22 |
49.72 |
1.63 |
|
18 |
297272 |
2.56 |
51.95 |
1.70 |
|
19 |
504047 |
4.34 |
83.16 |
2.73 |
|
20 |
722466 |
6.22 |
117.54 |
3.85 |
|
21 |
101200 |
0.87 |
210.56 |
6.90 |
|
Total |
11,607,407 |
100 |
30.42 |
1 |
Income distribution data: The income distribution data are taken from an extensive rural survey done in 1930-31 (Zimmerman 1999), which referred to the income period spring 1929 to spring 1930, a fairly normal year prior to the great depression and the fall in rice prices. While it included the province of Bangkok, it did not include the city itself (with a population of 506,000). However, provincial towns were included in the sample, which was reported by four regions (Center, South, North and Northeast) and five quintiles, yielding 20 income classes plus the top officialdom. All incomes are reported in nominal bhat. Persons per household were only available as regional averages. Since the original distribution excluded Bangkok, it excluded merchants, artisans and the urban poor. Call these the non-royal Bangkok residents. Having no information on any of these, we have in effect assumed that these economically heterogeneous groups among the non-royal residents replicated their share distribution outside of Bangkok. We do not, however, ignore what we call the “officialdom” (the royal family, bureaucrats, and the church hierarchy) since we know a great deal more about this top Bangkok-located income group. Under the traditional system, officials were entitled to kin muang, or “eat the realm” (Zimmerman 1999: vii), that is to receive as income taxes paid by the peasants. Thus, we allocate the reported 21,308,381 in tax revenues (listed by household in the original) to the officialdom, and we estimate that their number was about a fifth of the Bangkok population (101,200 or 18,333 families). This gives us the 21st social class.
Population and area: Population of 11,607,407 from Wilson (1983: 32-34, augmented by the 101,200 officialdom), and the area is 513,115 km2 (current area of Thailand).
Urbanization rate: The average of 9-11 percent given in Bairoch (1985, p. 522) for year 1930.
Mean income in $PPP: 1929 GDP per capita in 1990 international dollars was 799 (Maddison 1995: 204).
REFERENCES
Bairoch, Paul (1985), De Jėricho à Mexico: villes et economies dans l’histoire, Paris: Arcades, Gallimard.
Maddison, Angus (1995), Monitoring the World Economy 1820-1992, Paris: OECD.
Wilson, Constance M. (1983), Thailand: A Handbook of Historical Statistics, Boston: G.
K. Hall.
Zimmerman, Carle C. (1999), Siam Rural Economic Survey 1930-31, Bangkok: White
Lotus Press; originally published in 1931, Putnam’s, New York.
Tags: households, number, percentage, 19291930, income, class
- BRIEF INFORMATION ON REASEHEATH COLLEGE BOARD MEMBERS NICHOLAS CAREY
- V DZIEŃ SOLIDARNOŚCI Z OSOBAMI CHORUJĄCYMI NA SCHIZOFRENIĘ 10
- ZAŁĄCZNIK DO ZARZĄDZENIA NR 1458II2022 BURMISTRZA GOŁDAPI Z DNIA
- AGENCY CLAIMS INVESTIGATION DEPT OF ADMINISTRATION RISK MANAGEMENT DIVISION
- CARTILLA DE INSTRUCCIONES DECLARACIÓN DE PREDIOS – FORMULARIO VIRTUAL
- NA OSNOVU ČLANA 38 STAV 1 TAČKA 1 ZAKONA
- STAI20118 ADMINISTRATIVE INSTRUCTION REVIEW COMMITTEES ON CONTRACTS THE UNDERSECRETARYGENERAL
- SECURITY FOR PUBLIC DEPOSIT ACT ONLINE REPORTING SYSTEM USER
- DIEZ PRINCIPIOS DE LA EVALUACIÓN PARA EL APRENDIZAJE EVALUACIÓN
- L ONG BEACH WRAP “WINNERS REACHING AMAZING POTENTIAL”
- DECEMBER 2012 CALIFORNIA DEPARTMENT OF EDUCATION OFFICE OF SCHOOL
- ZAHTJEVI FIZIČKIH OSOBA PPUO GORNJA STUBICA ZAHTJEVI FIZIČKE
- PROJECT COLDS AND FLU RECRUITMENT QUESTIONNAIRE BRAND JULY 2014
- GODKJENT VERSJON RETNINGSLINJE FOR BISTAND FRA KOMMUNALT PERSONELL FOR
- LABORATORNÍ POSTUPY PŘI ZJIŠŤOVÁNÍ PŮDNÍCH VLASTNOSTÍ – ANALÝZY PROVÁDĚNÉ
- THE LAW REFORM COMMISSION OF HONG KONG CONDITIONAL FEES
- INSTRUCCIONES POR FAVOR RESPONDA CADA PREGUNTA COMPLETA Y CLARAMENTE
- DEPARTMENT OF THE INTERIOR DEPARTMENTAL MANUAL EFFECTIVE DATE 100793
- “MEETING THE NEEDS FOR LEARNING AND SKILLS IN
- DIPUTACIÓN DE GUADALAJARA CONVENIO ENTRE LA EXCMA DIPUTACIÓN PROVINCIAL
- PLAYER DECLARATION FAMILY NAME(S) FIRST NAME(S) DATE OF BIRTH
- CERTIFICATE OF ELECTION OF TOWN CLERK STATE OF VERMONT
- 1 (IME I PREZIME) (ADRESA) DRŽAVNI ARHIV U
- VNEA CHARTER 1024 LEAGUE RULES 1) THE LEAGUE
- BILAG 5 BASISOPLYSNINGER TEKST PROJEKTBESKRIVELSE (KAN VEDLÆGGES) NAVN ADRESSE
- DERS BİLGİ FORMU DERSİN ADI ELEKTRO MANYETIK DALGALARIN BIOLOJIK
- ФОТО (НЕ ОБЯЗАТЕЛЬНО ПРИ ЗАПОЛНЕНИИ В ЭЛЕКТРОННОМ ВИДЕ) АНКЕТА
- ADMINISTRACIÓN MUNICIPAL FUENGIROLA 3 ORDENANZA REGULADORA DEL IMPUESTO
- SISTEMA DE VISUALIZACIÓN DE DATOS DE PUNTOS DE MEDICIÓN
- OCUPACIÓN DEL AULA DE INFORMÁTICA OCTUBRE HORA LUNES
SB NO 1496 SB NO 1496 AN ACT RELATING
 ET TRYGT ARBEJDSMARKED B E S K Æ F
EL DELITO Y HOMICIDIO SEXUAL EN CONTEXTOS POLÍTICOS Y
ANTRAG AUF GENEHMIGUNG DER VERARBEITUNG PERSONENBEZOGENER DATEN VON SCHÜLERINNEN
I PUCHAR PUCKA 08 – 10 CZERWCA 2018 ELIMINACJE
 DIANA L NEUHARDT CURRICULUM VITAE CURRICULUM VITAE DIANA L
INFORMACJA O ZASADACH KWALIFIKOWANIA PRZESTĘPSTWA OKREŚLONEGO W ART 43
 POSITION SECRETARY DESCRIPTION MEETING MINUTES ADMINISTRATIVE TASKS AS ASSIGNED
 SUBVENCIONES DESTINADAS AL FOMENTO DE LA EFICIENCIA ENERGÉTICA Y
 HIGH SCHOOL EDUCATION COMMISSION OF THE STATES • 700
 4 10 HOJA DE VIDA PRÁCTICA PROFESIONAL DATOS DE
 j41 Reinforced Bitumen Membrane Roof Coverings Specification id web
EPSON CARDPCI EVALUATION BOARD HARDWARE MANUAL PLEASE NOTE THE
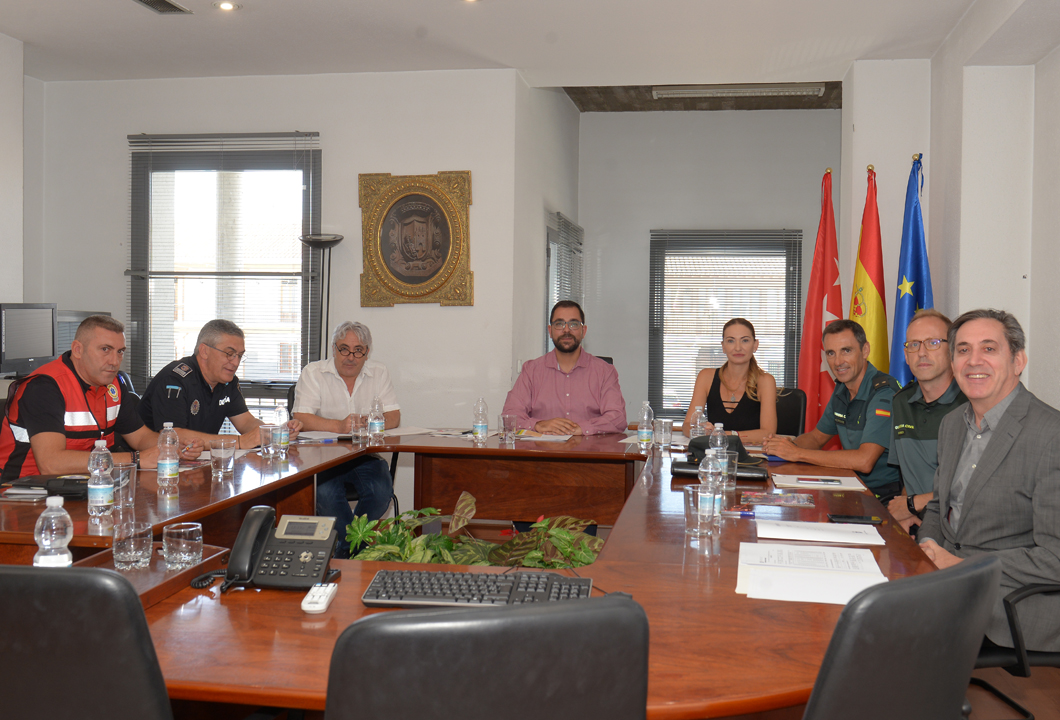 EN LA JUNTA LOCAL DE SEGURIDAD CELEBRADA HOY VALDEMORO
 SPECYFIKACJA TECHNICZNA WYKONANIA I ODBIORU ROBÓT SST202 INSTALACJE WODNE
 20202021 SAGE WOMEN’ S TENNIS TEAM “THE GATORS” NAME
EN LA CIUDAD DE SAN JUSTO PROVINCIA DE BUENOS
 CONTRATO DE COMPRAVENTA DE GRANOS “A FIJAR PRECIO” DATOS
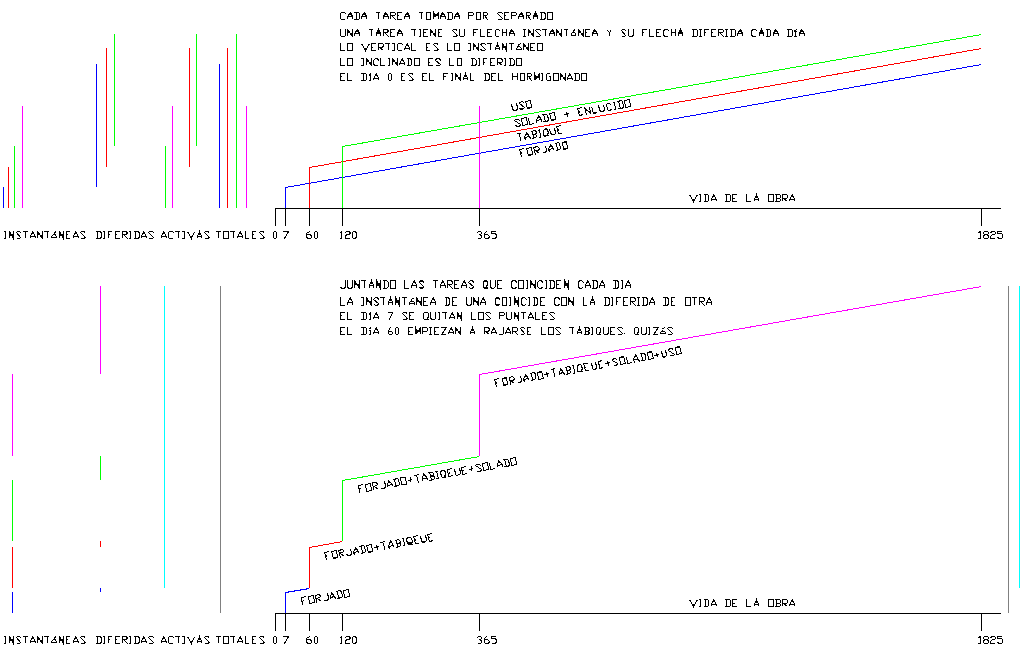 PROYECTO Y CONSTRUCCIÓN DE FORJADOS RETICULARES Y LOSA POLITÉCNICA
SAVJETI ZA POSLOPRIMCE ŽIVOTOPIS I MOLBA ZA ZAPOSLENJE ŽIVOTOPIS