CHROMATOGRAPHY OF PHOTOSYNTHETIC PIGMENTS STUDENTS’ SHEET INTRODUCTION THE
ACTIVITY I PLANT PIGMENT CHROMATOGRAPHY PART I IN THISBIOLOGY PLANT PIGMENTS AND CHROMATOGRAPHY LAB MRS DOUMA 2017
CHROMATOGRAPHY LAB BIOLOGY LAB 10 OBJECTIVE TO USE THE
CHROMATOGRAPHY OF PHOTOSYNTHETIC PIGMENTS STUDENTS’ SHEET INTRODUCTION THE
CHROMATOGRAPHY OF PHOTOSYNTHETIC PIGMENTS TECHNICAL & TEACHING NOTES
CHROMATOGRAPHY OF PHOTOSYNTHETIC PIGMENTS LEARNING OUTCOMES INTRODUCTION THESE LEARNING

Chromatography of photosynthetic pigments
Students’ Sheet
Introduction
The aim is to extract photosynthetic pigments from leaves and to separate them using thin layer chromatography in order to see multiple different pigments from a single extract and to allow the identification of the pigments through the calculation of their Rf values and observations of their colour.
This practical provides the opportunity for skills development in the use of chromatography to separate and identify substances from a biological sample.
![]()
Safety notes
The solvents used to extract the pigments from the leaves and run the chromatogram are highly flammable. Even the vapours they produce are highly flammable so ensure that there are no naked flames or other sources of ignition in the laboratory.
Wear eye protection when using the solvent.
Avoid inhaling vapour as much as possible by minimising the quantity of solvent used, minimising the escape of the vapour, ensure laboratory is well-ventilated. Be aware that the vapours may cause drowsiness or dizziness, inform the teacher if you feel you are being affected.
Instructions
C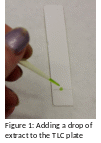 ollect
a Thin Layer Chromatography (TLC) plate (do not touch the white
surface of the plate – hold it by its sides) and gently draw a
pencil line approximately 1cm from, and parallel to, the bottom of
the plate.
Place plant material (ripped or cut up into small pieces if whole leaves are too big) in a mortar, (add a pinch of sand – optional) and grind with the pestle.
Add 1-2cm3 of the extraction solvent (propanone) and continue to grind until the liquid appears dark green in colour (add some more solvent if necessary).
Dip a micropipette tip/fine pipette into the liquid and transfer a tiny drop of the extract onto the middle of the pencil line on the TLC plate (see figure 1). Touch it briefly to ensure your spot gets no bigger than 3mm diameter.
Allow the spot to dry and then add another drop. Continue adding drops and drying until the spot is dark green (5-10 drops is usually enough).
Use the two halves of the split cork/bung to hold the chromatography plate at its top. Trial placing the chromatography plate and the cork into the vial to ensure that the plate doesn’t touch the sides of the vial and so that the bottom of the plate is very close to the bottom of the tube. Adjust the position of the plate in the cork/bung if necessary. Mark with a pencil where the cork needs to hold the plate. (Note: it is easiest to hold the chromatography plate between the two halves of the cork/bung by hanging the plate slight over the edge of the lab bench – see figure 2a-c).
Add some running solvent (made up of 5 parts cyclohexane: 3 parts propanone: 2 parts petroleum ether (80-100°C)) to a depth of 0.4-0.7cm in the vial (not approaching 1cm depth as that will be the level of the pigment spot).
Now place the chromatography plate, held by the cork, into the vial so that the plate dips into the solvent but the pigment spot is above the surface of the solvent (see figure 2d).
L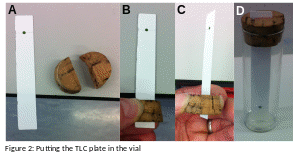 eave
the chromatogram to develop (about 5-10mins).
When the solvent front (the furthest the solvent has travelled) is about 1cm from the bottom of the cork remove the chromatography plate and place it on a white tile. Re-cork the vial to minimise evaporation of the running solvent.
Immediately mark the location of the solvent front using a pencil before the solvent evaporates.
P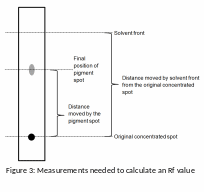 hotograph
the chromatogram (for analysis of the photograph) and mark the
location of each coloured spot. (The coloured spots can fade and
become difficult to locate as time goes by).
Record the colour of each spot and how far each spot has travelled from the original location.
Calculate an Rf value for each spot by dividing the distance moved by the spot (use the centre of the spot) from its original location by the distance moved by the solvent front from the same location (see figure 3).
Compare these Rf values, the relative position of the spot to other spots, and the colours recorded to Rf values, relative positions and colours for known photosynthetic pigments (use table 1 below) in order to identify the pigments you have isolated.
Table 1: Information to help identify pigments
|
Pigment |
Rf value range |
Colour |
Relative position |
|
Carotene |
0.89-0.98 |
Yellow |
Very close to the solvent front |
|
Pheophytin a |
0.42-0.49 |
Grey |
Below the top yellow, above the greens |
|
Pheophytin b |
0.33-0.40 |
Brown |
Below the top yellow, above the greens |
|
Chlorophyll a |
0.24-0.30 |
Blue green |
Above the other green, below the grey |
|
Chlorophyll b |
0.20-0.26 |
Green |
Below the other green |
|
Xanthophylls
|
0.04-0.28 |
Yellow |
Below, or almost at the same level of, the highest green |
Note: Rf values are given as a range due to the fact that the components of the solvent mixture evaporate at different rates. So the solvent mixture you are using might be in slightly different proportions to other times this chromatography is carried out. It is particularly dependent on environmental temperature. Also note that the solvent evaporates very quickly so the solvent front must be identified as soon as the plate is removed from the glassware – slight errors in the measurement of the solvent front or of the centre of the pigment spot will change the calculated Rf value.
Table 2: Information to help identify possible Xanthophylls
|
Pigment |
Rf value range |
Colour |
Relative position |
|
Lutein |
0.22-0.28 |
Yellow |
Below, or almost at the same level of, the highest green |
|
Violaxanthin |
0.13-0.19 |
Yellow |
Below, or almost at the same level of, the highest green |
|
Neoxanthin |
0.04-0.09 |
Yellow |
Below, or almost at the same level of, the highest green |
Questions
1. The method you used
What species did you investigate?
Why is it important to use an organic (non-polar) solvent and not a polar one like water?
What is the sand for? How could you prove that the pigments came from the plant material and not the sand?
Why is it important to mark positions in pencil rather than pen (particularly the starting position of the concentrated extract)?
Why is repeated application of the plant extract onto the same spot required?
Why is it important to let the spot dry in between each repeated application of the plant extract?
Why is it important that the spot of plant extract is above the surface of the solvent when the chromatography plate is placed in the vial?
Why is it important that the chromatogram is stopped before the solvent front reaches the top? What would happen to the pigment spots if the chromatogram was left running for a long time?
Why is it important to mark the solvent front quickly?
Why is it useful to mark the positions of the pigment spots or take a photograph of the chromatogram soon after it has been run?
How accurate is your measurement of how far the solvent front has travelled and how far each pigment spot has travelled (to the nearest 1cm, 0.1cm, 0.01cm or something different)? (Consider the limitations of the ruler you’re using and the difficulty in locating the exact position of the solvent front or centre of the pigment spot).
How could you modify the equipment/experiment, only very slightly in order to get more accurate measurements of the Rf values for each pigment?
What is the percentage error in the Rf values you get for each pigment spot?
What safety precautions did you, and the class as a whole take when using the solvent? Include ways in which you reduced the amount of solvent that evaporated into the air.
2. Your findings
Keep a record of your chromatogram (annotated drawing, photograph, the actual thing – labelled and annotated).
Calculate the Rf values for each of your pigments spots showing the measurements taken and the calculations made.
Is it possible to have an Rf value greater than 1? Explain.
Does it matter if different chromatograms are run for different lengths of time?
Draw a table to catalogue the information about your pigment spots (colour and Rf values) and include a column for which pigment you think each spot is and another column explaining why you have come to that conclusion.
What could be done to confirm the identity of each pigment if the results were unclear or if two molecules were a similar colour and/or their Rf values were very similar?
3. The biology of what you see and the science of chromatography
Where, exactly have you extracted the photosynthetic pigments from?
How does the fact that these pigments dissolve in an organic (relatively non-polar solvent) help explain the precise location of these pigments in plant cells?
Assuming that the distance the pigment travelled is based on the solubility of the molecule in the organic, relatively non-polar solvent, and its ability to bind to the polar stationary phase (the TLC pate) suggest what might be concluded about the differences in molecular structure between different pigments.
What is the role of these photosynthetic pigments in photosynthesis?
Why is it useful for a plant to have several different photosynthetic pigments?
Science & Plants for Schools: www.saps.org.uk
Chromatography
of leaf pigments – student notes: p.
Chromatography_Key
DEVELOPMENT OF LIQUID CHROMATOGRAPHYMASS SPECTROMETRIC PROCEDURES FOR THE ANALYSIS
EXPERIMENT 3 SEPARATION OF SPINACH PIGMENTS BY COLUMN CHROMATOGRAPHY
Tags: chromatography of, www.saps.org.uk chromatography, sheet, students’, chromatography, introduction, photosynthetic, pigments
- APT RAPPORTEUR ON ITUR RESOLUTION [CRS] 20120118 DRAFT NEW
- NOVEDADES SOBRE ALGUNOS NOMBRES DE PLANTAS EN EUSKERA JOSÉ
- INTERNATIONALT ARBEJDSGRUPPEMØDE D 12 OKTOBER 2010 DELTAGERE KJELD S
- DOW UNIVERSITY OF HEALTH SCIENCES RESEARCH DEPARTMENT RESEARCH FACILITATING
- LOS ALUMNOS DE 4º A 6º DE PRIMARIA DE
- ESTRUCTURA AGRARIA EN ESPAÑA ANALIZAR LA RENTA NACIONAL
- LEADERSHIP MODULE OUTLINE ALL COMMUNITIES MODULE 1 OF 1
- FONS CATALÀ DE COOPERACIÓ AL DESENVOLUPAMENT FORMULARI D’INFORME DE
- U NIT PLAN TEMPLATE NOTE TYPE IN THE
- UNIVERZA V LJUBLJANI FAKULTETA ZA DRUŽBENE VEDE MAG JASMINKA
- JUOZO TUMOVAIŽGANTO MEMORIALINIO BUTOMUZIEJAUS AUDIOGIDAS JUOZO TUMOVAIŽGANTO MEMORIALINIS BUTASMUZIEJUS
- SCREENING CENTRE FOR OUTPATIENT ENDOSCOPY SCOPE CLINIC 12470 CHRYSLER
- NAME CLASS DATE TOTAL POINTS UNIT 13
- DAVID A KOLB ON EXPERIENTIAL LEARNING DAVID A
- DECLARAÇÃO DECLARO PARA FINS DE CONCESSÃO DE BOLSA DE
- 1003 PDT MARY MCRAE ANNOUNCES THAT THE KMIP TC
- STICHTING HORST EN WEIDE SMARAGDHORST 324 2592 RX DEN
- STEPHEN M MAJERCIK 6 NOVEMBER 2021 STEPHEN M MAJERCIK
- RESULTADO DEL SEGUNDO EJERCICIO DEL PROCEDIMIENTO SELECTIVO CELEBRADO PARA
- USER’S MANUAL FOR THE LAPANIMAL USE QUALIFICATION (AUQ) WEBBASED
- PRESS RELEASE NOVEMBER 21 2011 MOULD SECTOR IS MEETING
- SILABUS MATA KULIAH SISTEM PENUNJANG KEPUTUSAN FAKULTAS ILMU
- 4 TD13386973 OPINIÓN Nº 1582018DTN ENTIDAD JURADO NACIONAL DE
- ELECTRICAL SAFETY ACT PASSED 22 MAY 2002 (RT1 I
- SECONDARY PGCE SUBJECT KNOWLEDGE AUDIT 20222023 ENGLISH NAME DATE
- KOMÜNIST PARTI ÜZERINE EPOCH TIMES YORUMLARI KISIM 8
- TECHNICKÉ PARAMETRE – OZNAČOVANIE ZÁSIELOK A ZVÄZKOV –––––––––––––––––––––––––––––––––––––––––––––––––––––––––––––––––�
- DIARIO LA PRENSA WWWLAPRENSAHNCOM DIARIO EL HERALDO WWWELHERALDOHN DIARIO
- 8 SPECIAL CARE FOR PRETERM AND LOW BIRTH WEIGHT
- 129937 CP 1 2006 1
 I MS QUESTION AND TEST INTEROPERABILITY A QA FOCUS
TIESAS SPRIEDUMS 1998 GADA 28 APRĪLĪ METRONOME MUSIK GMBH
REGISTRATION FEE DEAR JERUSALEM CONFERENCE GUEST THE ORGANIZING COMMITTEE
 FULL SERVICE QUALITY FRAMEWORK SELFASSESSMENT GUIDANCE AND INFORMATION FOR
SPECIAL USES SCREENING CHECKLIST 36CFR 25154 FSH 270911 122
ZNAK SPRAWY OKEREG262014 FORMULARZ CENOWY ZAŁĄCZNIK 2 NAZWA JEDNOSTKA
 FRAMINGHAM YOUTH LACROSSE – U13 GIRLS COACHING & SKILL
RESPONSABILIDAD DEL ARQUITECTO Y DEL PROMOTOR EN MATERIA DE
 SOLICITUD DE SOPORTE Y MANTENIMIENTO DE SERVICIOS TECNOLÓGICOS INFORMACIÓN
 198 REDOXREACTION WITH MANGANESE DESCRIPTION A MANGANESE (II) SOLUTION
 PŘÍLOHA Č 7A K METODICKÉMU POKYNU ČJ 2019ORS CONTRACT
 KRITERIA PENJELASAN PREFACE ORGANIZATIONAL PROFILE THE ORGANIZATIONAL PROFILE IS
CZĘŚĆ DLA WYDAWCY FORMULARZ RECENZJI SYGNATURA ARTYKUŁU RECENZJA
DIAGNOSTISCHE TOETS DE ONDERDELEN 1 TM 9 ZIJN UITSPRAKEN
 FEDERACIÓN MADRILEÑA DE AJEDREZ RECOGIDA DE DATOS PERSONALES
 MINUTA DE REUNION UNIDAD TELEMEDICINA TEMA VIDEOCONFERENCIA TELE NEFROLOGÍA
 PROYECTO DE INVESTIGACIÓN SOBRE PROBLEMAS AMBIENTALES UNIDAD 1 ENTORNO
WYKAZ DORADCÓW ŚODR PRZYDZIELONYCH DO PRACY W KOMISJACH KLĘSKOWYCH
SZKOLENIE PRACOWNIKÓW PUNKTÓW KONSULTACYJNYCH NUMER ZGŁOSZENIA ( WYPEŁNIA PARPA
 MYANMAR MONASTERIES RAIDED AS WORLD PLEADS FOR CALM B