T EACHER BACKGROUND UNIT 2 OCEAN CURRENTS AND
BIRDBRAIN TEACHER’S NOTES © ADT 2004 COMPILED BYDEAR PRESCHOOL OR KINDERGARTEN TEACHER WELCOME TO
PERSON SPECIFICATION CLASS TEACHER ESSENTIAL DESIRABLE
PERSON SPECIFICATION CLASS TEACHER 2018 ESSENTIAL DESIRABLE
SCU TEACHER EDUCATION PROGRAM PROFESSIONAL DISPOSITIONS OF
TEACHER RECRUITMENT DIFFICULTY CENSUS FREQUENTLY ASKED QUESTIONS
Looking For Another Greenhouse Gas: Methane
T EACHER
BACKGROUND Unit 2 - Ocean Currents and the Open Ocean
EACHER
BACKGROUND Unit 2 - Ocean Currents and the Open Ocean
Looking For Another Greenhouse Gas: Methane
Lesson by Judy D'Amore, Marine Science Centers
Port Townsend and Poulsbo, Washington.
Adapted, with permission from the Climate Protection Institute. The original activity, "Human Activity and Methane Production," appears in Global Warming Activities for High School Students, by Dorothy Rosenthal and Richard Golden, Climate Protection Institute, Oakland, CA, 1991.
K ey
Concepts
ey
Concepts
1. Production of methane, a greenhouse gas, can be linked directly to human activity.
2. The level of methane in the atmosphere is increasing rapidly.
Background
Methane (CH4) is a simple hydrocarbon, meaning it is a compound of hydrogen and carbon. Its present concentration in the atmosphere is only 1.68 parts per million, but is increasing at a high rate. This is cause for concern since methane is an extremely efficient absorber of infra-red radiation. In the next 30 years the concentration of methane in the atmosphere is expected to double. If this happens, the combined warming effect of methane and other trace greenhouse gases will equal that of carbon dioxide.
Analysis of air bubbles trapped in polar ice packs has shown that methane concentration in the atmosphere held steady for the last 10,000 years, but began to rise about 300 years ago. Its rate of increase has escalated over the past 100 years and now stands at 1% per year, greater than the annual increase of carbon dioxide (0.4%).
There is no clear consensus among scientists about why the concentration of methane is rising so rapidly. Much of it comes from the breakdown of plant material in the absence of oxygen, as in swamps, and the guts of termites and cattle. However, much methane is also produced through certain human activities which have increased as human population has grown.
Materials
For each student:
• “Looking For Another Greenhouse Gas: Methane” student activity pages
• graph paper (unless you ask students to provide their own)
Teaching Hints
“Looking for Another Greenhouse Gas: Methane” introduces your students to sources of methane gas in the atmosphere and to changes in atmospheric methane concentrations over time.
Distribute copies of the student worksheet and allow students time to go through the questions and graphing activities either individually or in groups.
Problem 5, the graphing exercise, may require some guidance. Students may not have had experience with the use of two vertical axes on a graph. You may need to model drawing and interpreting such a graph. Also call attention to the irregular intervals between the data points provided. Caution them that the X-axis should still be laid out in regular intervals (50-year intervals, for example). For best resolution, have students number the Y-axes to include only the range of values which show up in the data, rather than beginning the scale at zero.
When students have completed the exercise, allow time for a discussion of the answers.
Key Words
deforestation - clear of forest or trees
methane - a colorless, odorless, flammable gas, CH4; natural gas
Answer Key
1 a. Methane, especially because it is a gas, can readily escape if there are leaks in drilling and transportation apparatus. It may also escape in our homes as stoves are turned on and off.
b. Escaped methane goes into the atmosphere.
2. Increased human population need for agricultural land area deforestation broken wood, dead roots increased termite population wood-digesting microorganisms methane as a digestive waste increased atmospheric methane.
3 a. The average American eats about 114 lbs. of beef in a year.
b. The United States population consumed 28,500 million lbs. of beef in 1990.
c. The beef consumed in the United States in 1990 put 9,500 million lbs of methane into the atmosphere.
4. As the earth warms, polar regions will warm, releasing methane trapped in the frozen ground.
5. Sources of methane:
Wetlands and swamps have been both increasing and decreasing. Cultivated wetlands are increasing for production of crops like rice and cranberries. Wild wetlands are decreasing as the land is drained for other purposes.
Cattle have increased due to increased demand for beef products around the world.
Burning of tropical rain forests and tropical grasslands have increased to provide more land for agriculture and grazing of cattle.
Mining and drilling for natural gas have increased due to demand for raw materials and fuel.
Human-made landfills and dumps increased as growing population creates an increasing amount of waste.
Termites and other insects have increased from deforestation. (Eventually termites may decline as wood debris is cleared from land)
Oceans are not increasing or decreasing.
Lakes have increased through damming of rivers for hydroelectricity and flood control.
Arctic tundra is neither increasing nor decreasing at present, but might decrease if polar regions are affected by global warming.
6 a. Both population and atmospheric methane are increasing.
b. Human population probably is causing the increase in methane production.
c. Both will be extremely high, perhaps off the scale of students' graphs.
d. Current trends might be changed by stabilizing population growth and reducing activities which cause methane production, such as items listed in question #5.
L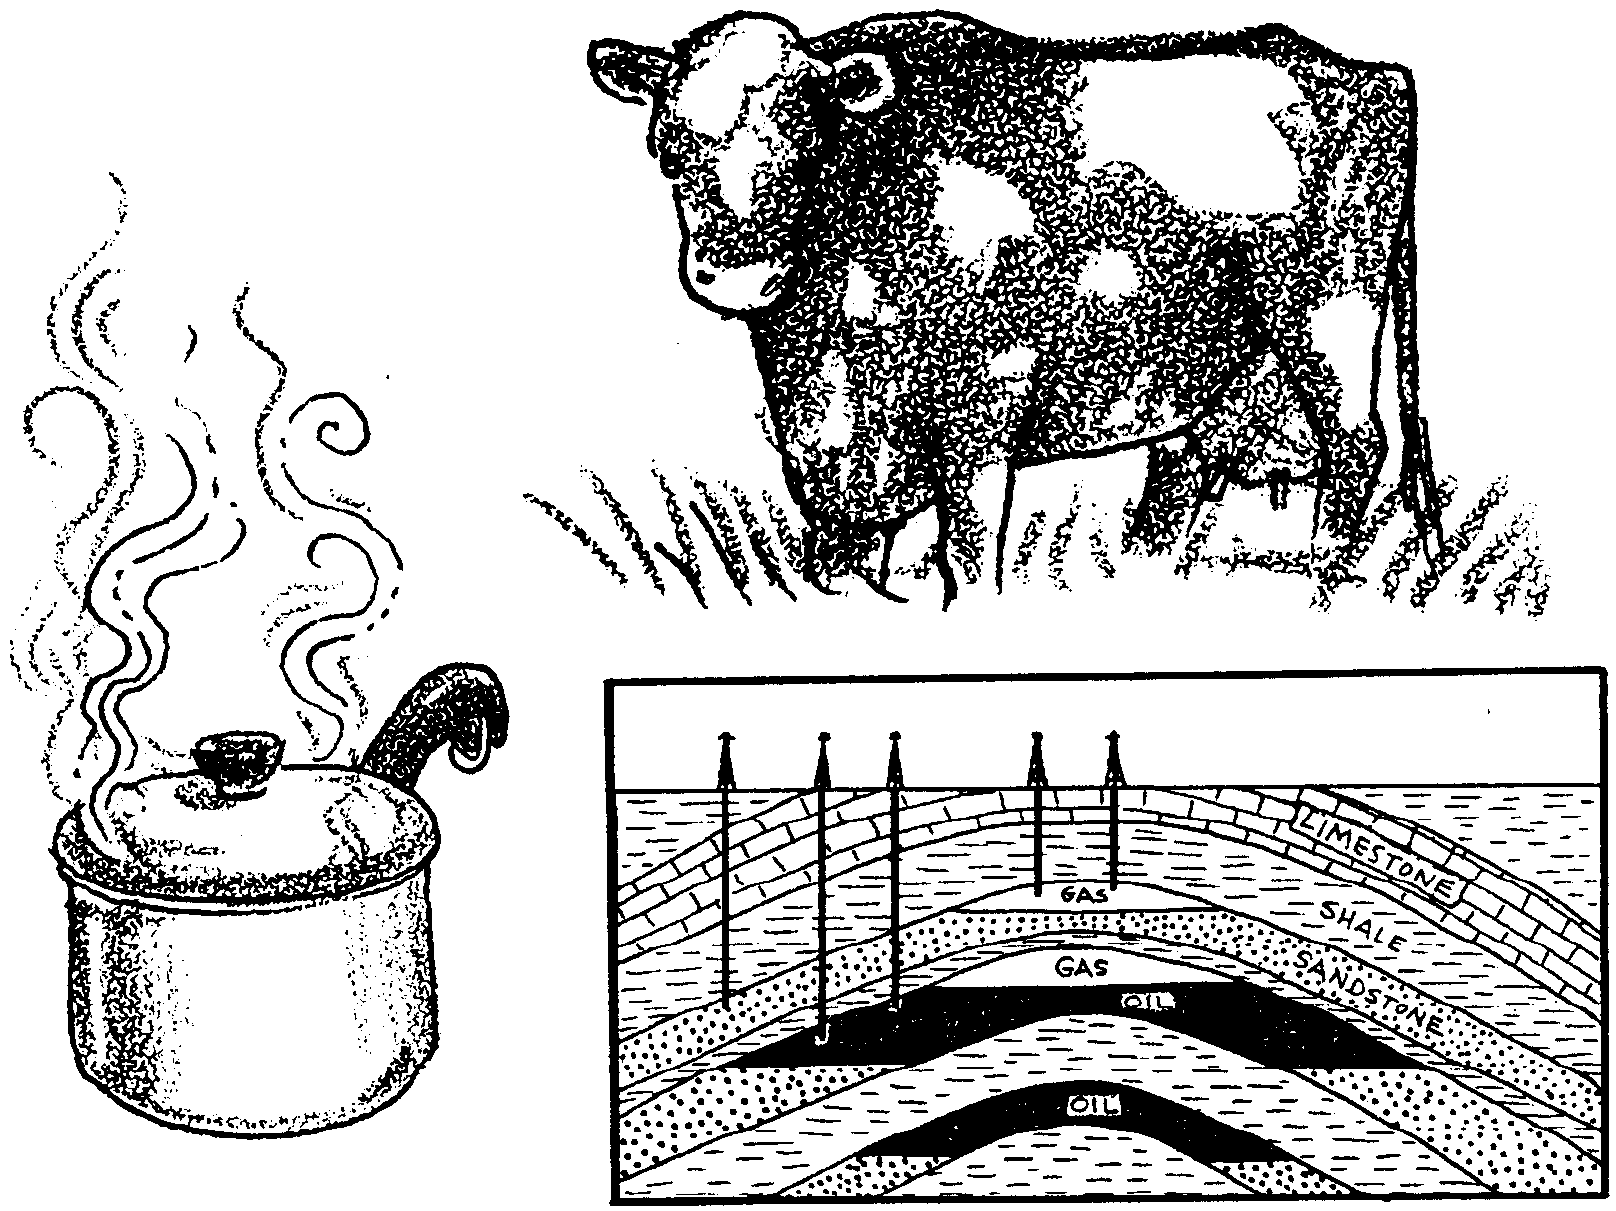
ooking
For Another Greenhouse Gas: Methane
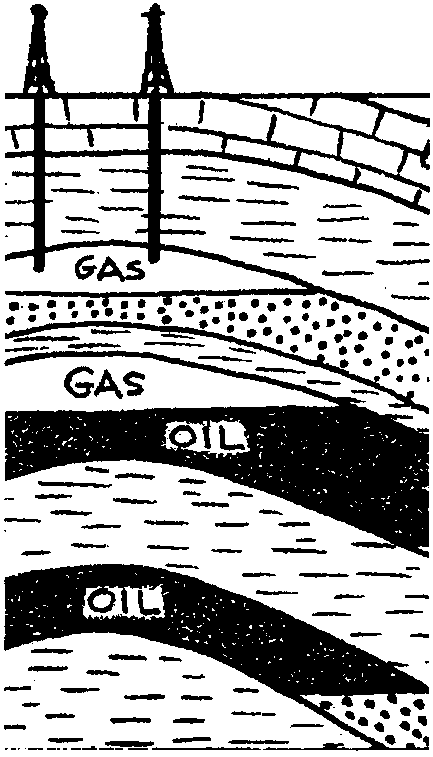
1. The natural gas that we burn in our homes for heating and cooking is about 90% methane. It has been released by drilling into trapped underground pockets of the gas.
a. How might gas escape in the process of drilling, transportation or as it is being used?
b. Where does escaped gas go?
Micro-organisms capable of digesting wood live in the guts of termites. One of their waste products is methane. As deforestation continues around the world, the supply of rotting wood has increased. This abundant food source has expanded the termite population, increasing their release of methane to the atmosphere.
2. Use the following statements to draw a flow chart diagram which shows how they are related through cause and effect. (Hint: First put them in order.)
Increased atmospheric methane
Increased termite population
Increased human population
Deforestation
Need for agricultural land area
Wood-digesting microorganisms
Broken wood, dead roots
Methane as a digestive waste
Cattle, goats and sheep emit methane as they digest grass and other fibrous plants. Each head of American beef cattle belches out about a third of a pound of methane per pound of beef it yields. (If you add in the carbon released from fuels burned in animal farming, every pound of steak has the same greenhouse-warming effect as a 25 mile drive in a typical American car!)
3a. The average American eats about 2.2 lbs. of beef every week. Multiply that by 52 to find out how much an average American eats in a year.
b. In 1990 the population of the United states was about 250 million. What was annual consumption of beef by the population of the United States in 1990?
c. If each pound of beef consumed puts 1/3 lb of methane into the atmosphere, how much methane was produced by the beef consumed in the year 1990?
The permafrost of tundra regions and polar ocean sediments contain vast quantities of methane trapped by frozen water molecules.
4. How might global warming affect this reservoir of methane?
5. Below is a list of places where methane is produced. The list is in order of highest to lowest in methane production. For each item on the list, state whether you think it has increased, decreased or remained unchanged as a result of human activities. Give a reason for each of your answers.
a. wetlands and swamps, including land irrigated to grow rice
b. cattle
c. burning of tropical rain forests and tropical grasslands
d. mining and drilling for natural gas
e. human-made landfills and dumps
f. termites and other insects
g. oceans
h. lakes
i. arctic tundra
6. On graph paper, construct a chart with the years 1500-2000 A.D. listed along the horizontal axis, and Methane Concentration in the Atmosphere (ppm) written along the left vertical axis. Construct a right vertical axis showing World Population (in billions).

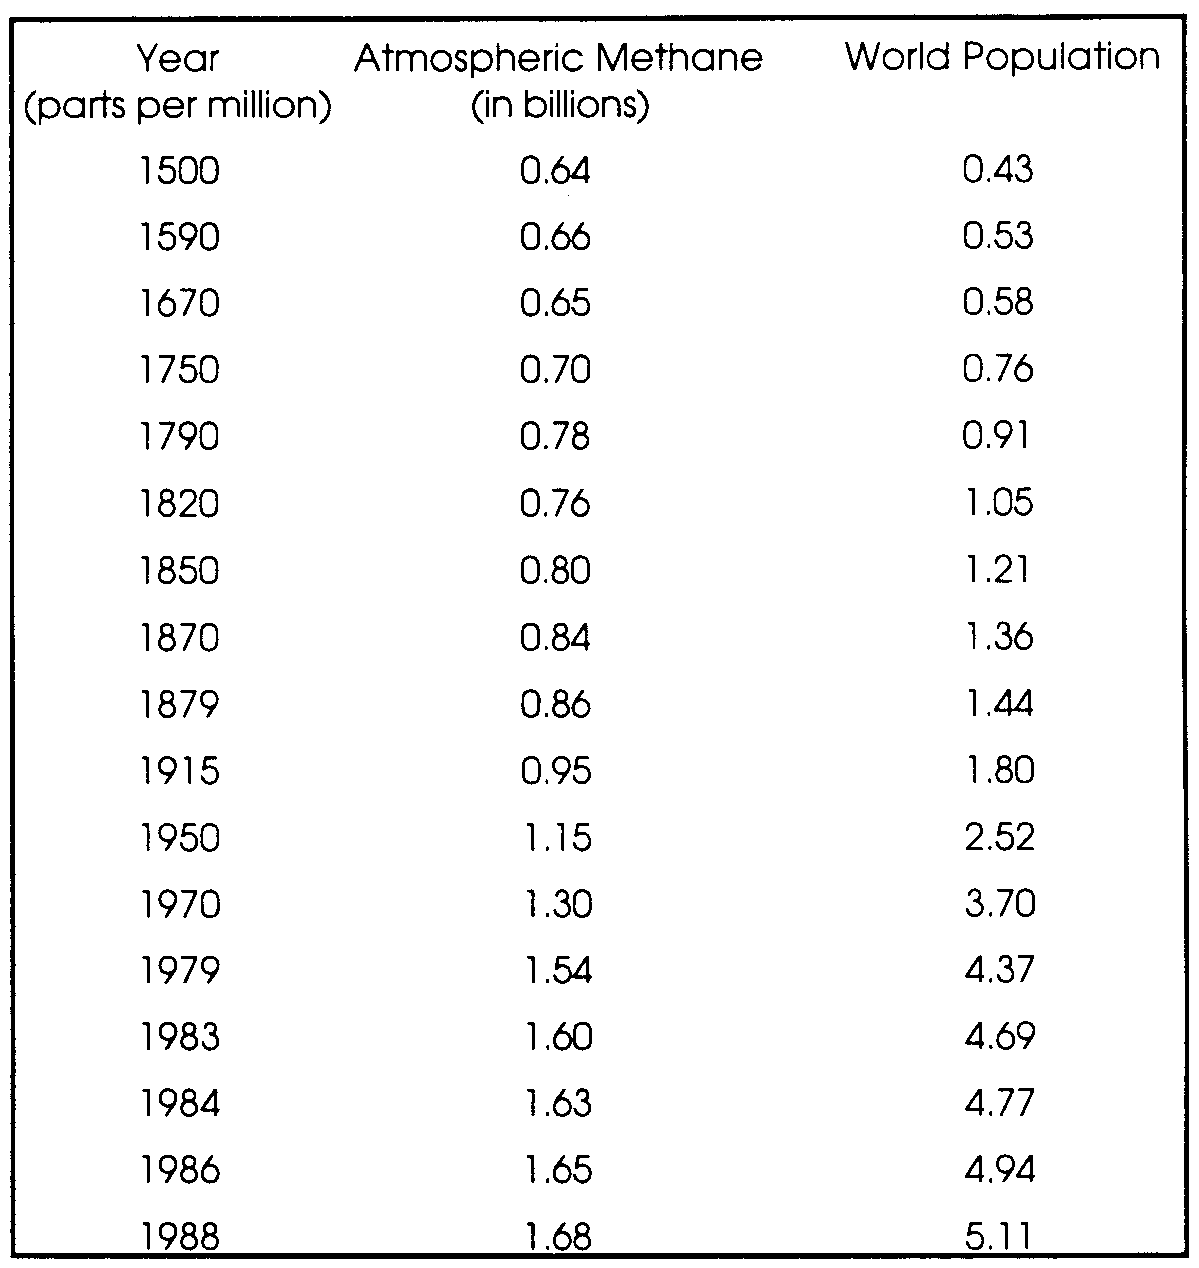
Plot the data at right as two lines on your chart. Here's how:
a. graph Atmospheric Methane on the left side of the vertical (y) axis against the Year on the horizontal (x) axis.
b. Next, on the same graph, use the right side of the vertical (y) axis to plot World Population against the Year on the horizontal (x) axis.
Questions:
a. Looking at the graph, what can you say about how the two lines have changed over time?
b. What relationship between the population and methane production does this graph suggest?
c. If present trends continue, where will world population and methane production be on your graph in the year 2050?
d. What might change present trends?
L
ooking
For Another Greenhouse Gas: Methane
1. The natural gas that we burn in our homes for heating and cooking is about 90% methane. It has been released by drilling into trapped underground pockets of the gas.
a. How might gas escape in the process of drilling, transportation or as it is being used?
b. Where does escaped gas go?
Micro-organisms capable of digesting wood live in the guts of termites. One of their waste products is methane. As deforestation continues around the world, the supply of rotting wood has increased. This abundant food source has expanded the termite population, increasing their release of methane to the atmosphere.
2. Use the following statements to draw a flow chart diagram which shows how they are related through cause and effect. (Hint: First put them in order.)
Increased atmospheric methane
Increased termite population
Increased human population
Deforestation
Need for agricultural land area
Wood-digesting microorganisms
Broken wood, dead roots
Methane as a digestive waste
Cattle, goats and sheep emit methane as they digest grass and other fibrous plants. Each head of American beef cattle belches out about a third of a pound of methane per pound of beef it yields. (If you add in the carbon released from fuels burned in animal farming, every pound of steak has the same greenhouse-warming effect as a 25 mile drive in a typical American car!)
3a. The average American eats about 2.2 lbs. of beef every week. Multiply that by 52 to find out how much an average American eats in a year.
b. In 1990 the population of the United states was about 250 million. What was annual consumption of beef by the population of the United States in 1990?
c. If each pound of beef consumed puts 1/3 lb of methane into the atmosphere, how much methane was produced by the beef consumed in the year 1990?
The permafrost of tundra regions and polar ocean sediments contain vast quantities of methane trapped by frozen water molecules.
4. How might global warming affect this reservoir of methane?
5. Below is a list of places where methane is produced. The list is in order of highest to lowest in methane production. For each item on the list, state whether you think it has increased, decreased or remained unchanged as a result of human activities. Give a reason for each of your answers.
a. wetlands and swamps, including land irrigated to grow rice
b. cattle
c. burning of tropical rain forests and tropical grasslands
d. mining and drilling for natural gas
e. human-made landfills and dumps
f. termites and other insects
g. oceans
h. lakes
i. arctic tundra
6. On graph paper, construct a chart with the years 1500-2000 A.D. listed along the horizontal axis, and Methane Concentration in the Atmosphere (ppm) written along the left vertical axis. Construct a right vertical axis showing World Population (in billions).
Plot the data at right as two lines on your chart. Here's how:
a. graph Atmospheric Methane on the left side of the vertical (y) axis against the Year on the horizontal (x) axis.
b. Next, on the same graph, use the right side of the vertical (y) axis to plot World Population against the Year on the horizontal (x) axis.
Questions:
a. Looking at the graph, what can you say about how the two lines have changed over time?
b. What relationship between the population and methane production does this graph suggest?
c. If present trends continue, where will world population and methane production be on your graph in the year 2050?
d. What might change present trends?
 EACHER
BACKGROUND - Looking For Another Greenhouse Gas: Methane
EACHER
BACKGROUND - Looking For Another Greenhouse Gas: Methane
FOR SEA—Institute of Marine Science ©2000 J. A. Kolb
(TEACHERS’ SHARING) DRESS SENSE AND APPRECIATION OF FASHION AIMS
0 CADET TEACHER ACADEMY CADET TEACCADETHER ACADEMY CADET TEACHER
1 ST MARCH BRATISLAVA DEAR MY ENGLISH TEACHER I
Tags: background unit, eacher background, ocean, eacher, background, currents
- THE COMMUNICATIVE INSANDOUTS OF CORE VALUES A QUALITATIVE ANALYSIS
- NOTICE IN ACCORDANCE WITH SECTION 10 EC (PUBLIC
- FOLLOW US ON TWITTER BERKLAWBIZNET • LIKE US ON
- MINISTARSTVO POLJOPRIVREDE UPRAVA ZA VETERINARSTVO I SIGURNOST HRANE
- COMUNICADO DE PRENSA AGOSTO DE 2020 LA FAMILIA RENAULT
- MINISTERSTVO ŽIVOTNÉHO PROSTREDIA SLOVENSKEJ REPUBLIKY DODATOK Č 1 K
- JOB TITLE RECEPTION ASSISTANT RESPONSIBLE TO RESCEPTION SUPERVISOR AND
- CÓDIGO ÉTICO FUNDACIÓN CERMI MUJERES ANTE LA IMPOSIBILIDAD DE
- ODPOVĚDI NA DOTAZY ČLENŮ ÚSTAVNĚPRÁVNÍHO VÝBORU VZNESENÉ NA JEDNÁNÍ
- ENERGY SAVER INCENTIVE VICTORIAN ENERGY EFFICIENCY TARGET (VEET) SCHEME
- PRACTICE MULTIPLE CHOICE FROM TEST ON INTERNAL CONTROL CHAPTER
- AN DEN VORSITZENDEN DES MASTERPRÜFUNGSAUSSCHUSSES GEOGRAPHIE GEOGRAPHISCHES INSTITUT JOHANNES
- PŘÍLOHA CHARAKTERISTIKA ANC OD ROKU 2018 HORSKÉ ANC PRO
- PREGUNTAS PARA TENERIFE CARLOS G ROY HAY UNA SERIE
- I AM SUBMITTING THIS DECLARATION FOR PHYS3061 □ AN
- REKOMENDACIJOS ŠANČIŲ MIKRORAJONO GYVENTOJAMS PRAMONINĖS AVARIJOS UAB MARGŪNAS“ ATVEJU
- WAYS OF RUSSIAN THEOLOGY FR GEORGE FLOROVSKY
- CANZONILEGGENDE PER LA VEGLIA ALLE STELLE PICCOLO ATTILA (DI
- LOS PLIEGOS DE CLÁUSULAS ADMINISTRATIVAS PARTICULARES DEBERÁN PASAR A
- SAMBUTAN DAN PAPARAN KETUA MAJELIS WALI AMANAT ITB PADA
- 15 PATVIRTINTA JONAVOS RAJONO SAVIVALDYBĖS TARYBOS 2014 M BALANDŽIO
- RIGHTSED UNDERSTANDING HUMAN RIGHTS UNDERSTANDING HUMAN RIGHTS UNDERSTANDING HUMAN
- PRINCIPIO DEL FORMULARIO DRET A LAVORTAMENT EL COMBAT CONTINUA
- APPLICATION FOR LAWYERS PROFESSIONAL LIABILITY INSURANCE “WITH CERTAIN UNDERWRITERS
- WWWREFLEJOSDELUZNET MARCHA DEL SILENCIO ACOMODO 1) CRUZ ALTA Y
- BỔ NHIỆM GIÁM ĐỊNH VIÊN TƯ PHÁP XÂY DỰNG
- ZAPISNIK 4 REDNE SEJE OBČINSKEGA SVETA OBČINE VOJNIK KI
- PROPOSED SHARED LEAVE POOL I PURPOSE TO PROVIDE A
- TEKST „ABBA OJCZE” 1 TY WYZWOLIŁEŚ NAS PANIE
- KIRTIMŲ LAIKO RIBOJIMAI (MIŠKO KIRTIMŲ TAISYKLĖS) 11 II MIŠKŲ
HATZIC MIDDLE PAC MEETING MINUTES GENERAL MEETING OCTOBER 22ND
 1 WARSZAWA DN 10082009R 2 3 1 KOMUNIKAT NR
PROGRAMA DE ACTIVIDADES WHAT´S ON IN ESTEPONA AGOSTO –
EL PACTO DE CUOTA LITIS Y LOS INCAPACES HIGHTON
 CENTRALA STUDIESTÖDSNÄMNDENS FÖRESKRIFTER OCH ALLMÄNNA RÅD (CSNFS 20171) OM
LAMPIRAN 1 A SURAT EDARAN KEPALA BADAN ADMINISTRASI KEPEGAWAIAN
 SZABLON UMOWA SPRZEDAŻY ENERGII ELEKTRYCZNEJ I ŚWIADCZENIA USŁUG
FUNDAMENTOS DE ADMINISTRACIÓN Y GESTIÓN EN EL MARCO DEL
 2411 CIRCULAR INFORMATIVA CONVOCATÒRIA D’AVALUACIÓ I ACREDITACIÓ DE
GRAU EN HUMANITATS 202021 3R CURS 1R SEMESTRE (DEL
 HORARIOS CURSO ESCOLAR 20142015 ALEMÁN CURSO DIAS HORA PROFESORA
KEEP CARBONDALE BEAUTIFUL INC SPRING CLEAN UP & RECYCLING
APSTIPRINĀTS AKADĒMISKĀ DARBA PROREKTORS ASOC PROFESORS AVECUMNIEKS 2006GADA 3MARTĀ
 AJUNTAMENT D’ESPARREGUERA SOL·LICITUD DE REDUCCIÓ EN CONCEPTE DELS DIFERENTS
 COMBINATION TOOLS 3AII (3 GRADE 3) (A
 3 CONTRATO DE COMPRAVENTA DE BIEN MUEBLE CON PAGO
 PRETESTPOSTTEST TELEPHONE CALLS INSTRUCTION 1 THERE ARE 10
4 OBČINA HAJDINA ZG HAJDINA 44A 2288 HAJDINA
EN TORNO A LA PUBLICIDAD COMERCIAL Y SU REGULACION
 IF YOU REQUIRE A LETTER TO CONFIRM THE ITEMS
